Mapping the crops with the most potential in a changing climate

The climate is changing, which means some crops will fair better or worse given new conditions. Stamen, in collaboration with Vision for Adapted Crops and Soils, mapped the potential shifts for a variety of crops.

Be sure to see Stamen’s process post on the design choices behind the visual explorer.

Tags: , , ,

A hotter year, again

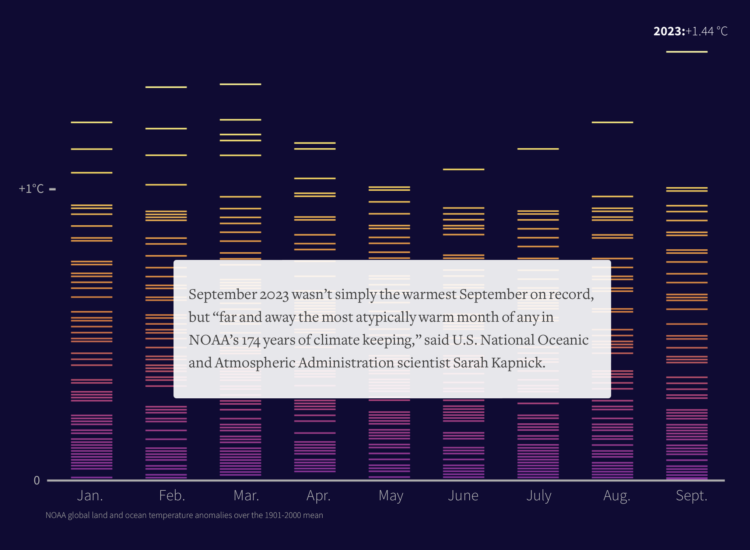
This year, 2023, was the hottest year on record. For Reuters, Gloria Dickie, Travis Hartman and Clare Trainor highlight the rising temperatures and the bad stuff that follows.

This year’s added warming has been like pouring gasoline on a fire. Extremes became more extreme. Warmer ocean waters fed stronger storms. Heatwaves persisted for weeks instead of days. And wildfires, feeding on dry forests and high temperatures, burned out of control.

An El Nino climate pattern, which emerged in the Eastern Pacific in June, is making things worse, scientists said. It’s boosting the warming caused by climate change, unleashing more catastrophic extremes.

Temperature extremes are still worth highlighting, but there are only so many ways to show an increase over and over again. Maybe someone can make a global warming exhibit that starts at the temperature highs of the 1800s and very quickly increases temperature to current highs. Throw in some VR with storms and wildfires.

Tags: , , ,

Hot surfaces, stored energy

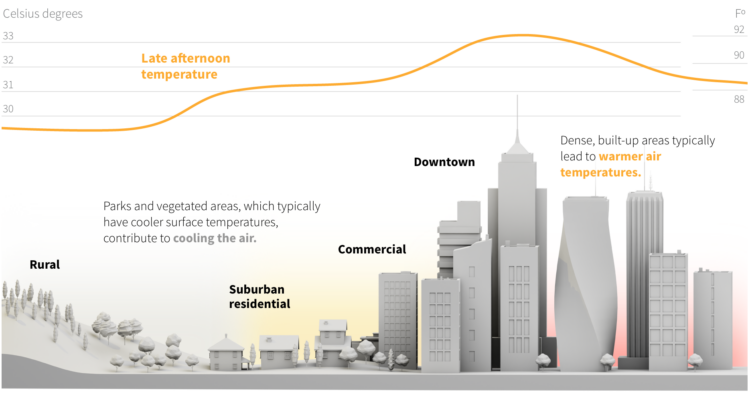
In hot places, the ground can heat to higher temperatures than the air, which causes severe burns to someone who stumbles or accidentally touches a surface. For Reuters, Mariano Zafra describes the absorption and release of energy with a series of graphics.

Tags: , ,

Line chart race to show emissions

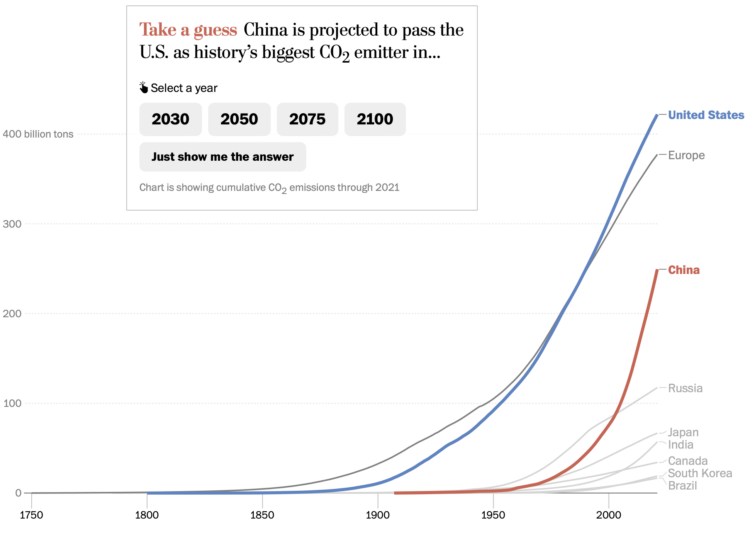
For The Washington Post, Harry Stevens used the line chart equivalent of a bar chart race to show when China is projected to pass the United States in total emissions. There is some quiz action to pique your interest.

Despite the popularity of the bar chart race, some hold a high level of disdain for the method, because it’s hard to pick out an overall pattern. It also takes more time to animate rankings when you can often see the same thing much quicker with a line chart.

The line chart race, which I think popped up a bit after the bar chart race, also takes time to show all the data. However, it comes with a bonus that the vertical scale can adjust to the current segment of data displayed, which lets you see how the patterns evolve.

Tags: , ,

Mapping climate-related hazards in real-time

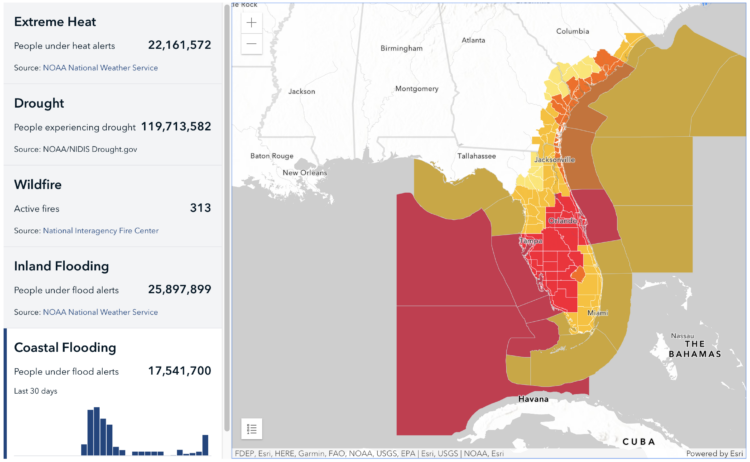
Bringing in data from various federal agencies:

Climate Mapping for Resilience and Adaptation (CMRA) integrates information from across the federal government to help people consider their local exposure to climate-related hazards. People working in community organizations or for local, Tribal, state, or Federal governments can use the site to help them develop equitable climate resilience plans to protect people, property, and infrastructure.

Tags: ,

Climate and the San Francisco fog

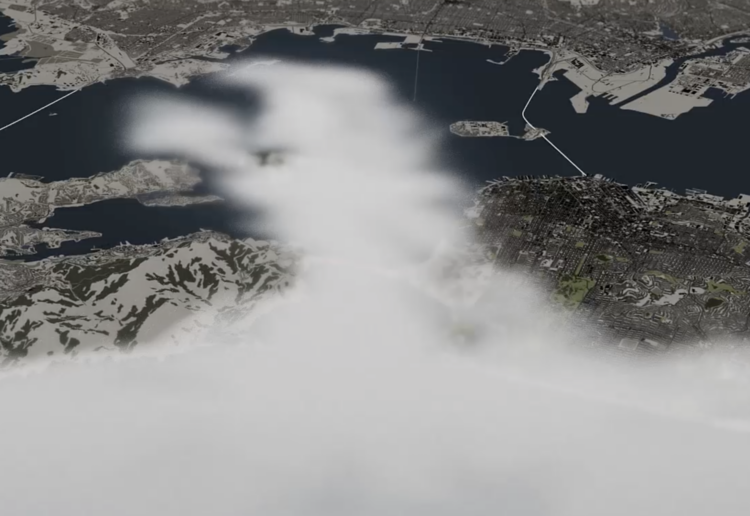
A reliable dense fog in San Francisco is a defining characteristic of the city, to the delight of some and less delight to others, but the pattern of fog could be on its way out as the climate changes. Scott Reinhard, for The New York Times, visualized the flow of fog and what sucks it into the bay. That intro image is something.

Tags: , , ,

Welcome to Meltsville

It’s getting hot in cities around the world, each city with its own set of problems. The Washington Post combined all the problems into one fictional city called Meltsville. There are travel delays because the road is melting, bridges are cracking from heat expansion, and it’s generally a hard place to live.

Tags: , ,

Megaflood scenario

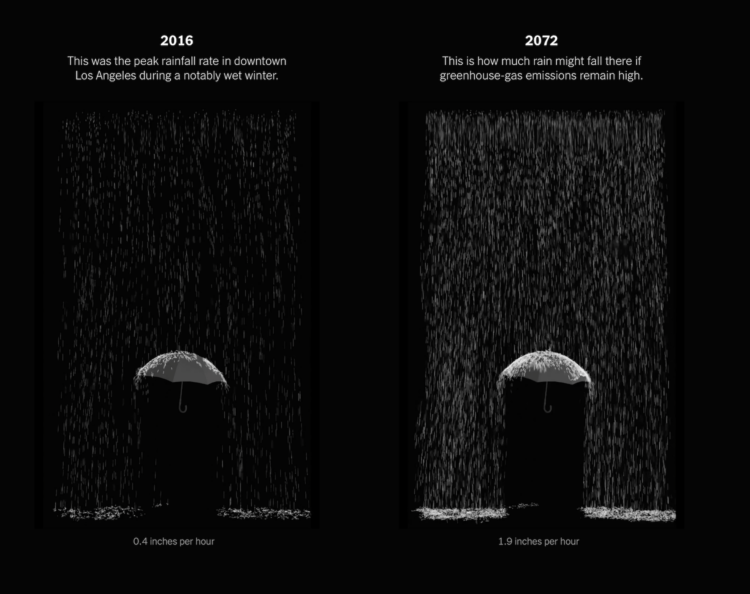
Highlighting research by Xingying Huang and Daniel L. Swain, who studied “plausible worst case scenario” extreme storm sequences, The New York Times provides a glimpse of what that might look like in California. There are maps, there are charts, and there is an augmented reality view to put rain in your living room.

Tags: , , , ,

Worst drought in Europe, in 500 years

Dominic Royé mapped river discharge in Europe over the past few months:

This climate change thing seems real.

Tags: , , ,

Mapping extreme heat

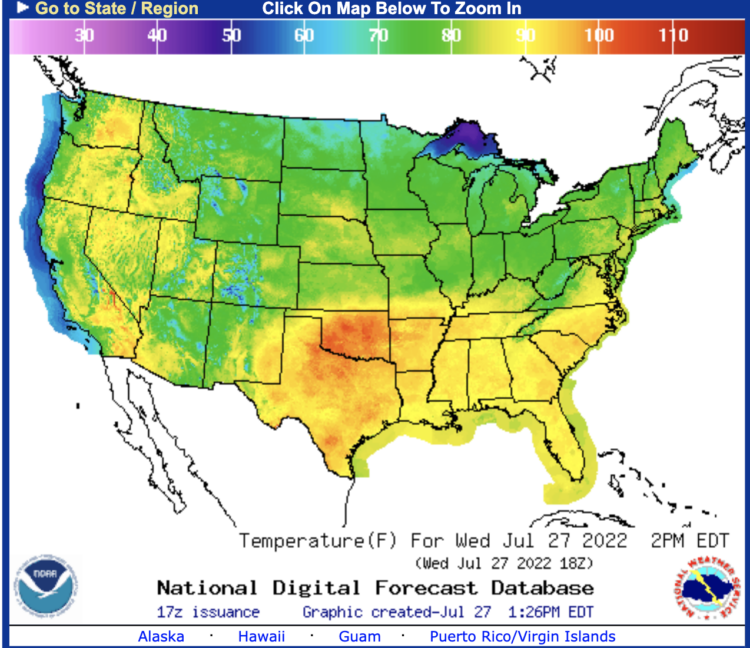
For Bloomberg, Marie Patino reports on the shifting design choices for mapping weather extremes. The rainbow color scheme and sunny icons aren’t cutting it anymore.

Tags: , , ,