Canned goods are an emergency preparedness staple. And for good reason. They are reasonably affordable, require little to no preparation, and have a long shelf life. These characteristics make them a good choice for your emergency food supply.
As often as people buy and cook with canned goods, they can find food labels confusing.(1, 2) Because labels are required for most packaged foods, it’s good to know how to read and understand them.(3)
Knowing how to read food labels is a practical skill that can help you avoid food allergens, reduce sodium and sugar in your diet, reduce food waste, and better manage your emergency food supply.
Here are three ways you can improve your food label literacy.
Learn to Identify Allergens
Food allergies affect millions of Americans and their families. They occur when the body’s immune system overreacts to certain proteins in food.
Food allergic reactions vary in severity. Mild symptoms can include hives and lip swelling. One severe, life-threatening reaction, often called anaphylaxis, may involve fatal respiratory problems and shock.(4)
The best way to prevent a food allergy reaction is to avoid the foods that cause reactions.
Laws and regulations, such as the Food Allergen Labeling and Consumer Protection Act of 2004 (FALCPA), and the Food Allergy Safety, Treatment, Education and Research Act (FASTER) make it easier for people to identify potential food allergies in food products.
FALCPA requires labeling for the eight most common food allergens. They are milk, eggs, fish, crustacean shellfish, wheat, soy, peanuts, and tree nuts.
FASTER identifies sesame as a major food allergen. Food labels must start to identify sesame as an allergen beginning January 1, 2023.
FALCPA says the name of the food source of a major food allergen must appear in one of three ways:
- Using the allergens common name in the ingredient list (e.g., milk).
- In the ingredient list in parentheses after the name of a less common form of the allergen (e.g., “lecithin (soy),” “flour (wheat),” and “whey (milk)”).
- Immediately after or next to the list of ingredients in a “contains” statement. (e.g., “Contains wheat, milk, and soy.”).(5)
Consumers may also see advisory statements such as “may contain [allergen] or “produced in a facility that also uses [allergen].” Statements like these are used to address “cross-contact,” which can occur in different ways:
- When multiple foods are produced in the same facility using shared equipment.
- When multiple foods are produced on the same production line.
- As the result of dust or aerosols containing an allergen.(4)
Make a habit of carefully reading labels even for foods you purchase often because ingredients and manufacturing processes can change. Reading labels each time you shop to avoid food allergens will ensure your emergency food supply is ready when you need it.
Be Informed About Expiration Dates
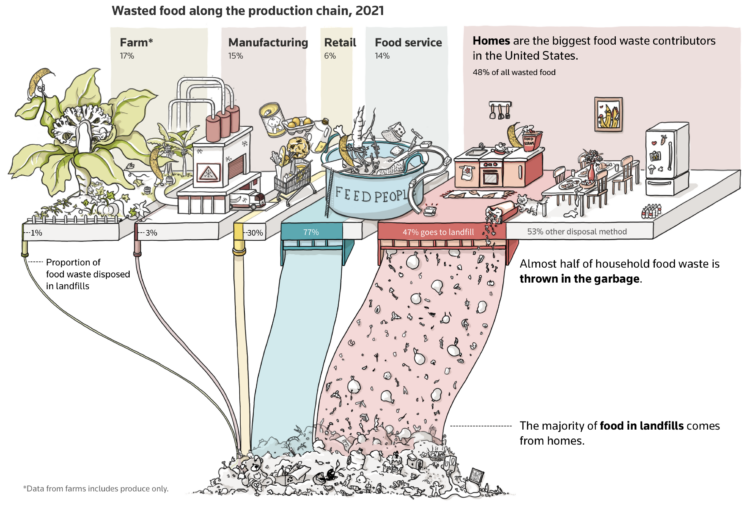
Americans throw away almost 40 million tons of food every year. Confusion over date labeling accounts for an estimated 20% of consumer food waste, according to FDA.(6)
Many people incorrectly think phrases like “Best By” and “Best if Used By” refer to food safety. Manufacturers use phrases like these to refer to when the food is at peak freshness and flavor.
Shelf-stable foods like canned goods can last for years past their “best by” date if the can is in good condition. That means no rust, dents, or signs of swelling.(7)
Vermont Law School’s Center for Agriculture and Food Systems launched the “Labels Unwrapped” website to help you better understand food labels. The “Labels 101” resource includes examples of common phrases on food packaging and explanations of the terms used to communicate quality.
After an emergency, it’s important that you take steps to prevent illness from unsafe food. Visit CDC’s website for information on what to do with food after an emergency or disaster.
Get the FoodKeeper App
The FoodKeeper app was developed by the USDA’s Food Safety and Inspection Service and others to help you understand how to store food and beverages.
The app allows you to search different foods by category for information about when you should consume them and how to safely store them. For example, the app recommends that you keep low-acid, unopened canned goods like stew, soups, and beans in the pantry.
The app also suggests you eat them within 2 to 5 years of purchase. You should refrigerate and eat low-acid canned goods within 3 to 4 days after opening.
Use your new understanding of food labels and tools like the FoodKeeper app to help you manage your pantry and maintain your emergency food supply. At the same time, you can avoid allergens, reduce waste, and save money on your food bill.
Resources
References
- https://www.usatoday.com/story/money/2020/03/02/soup-tuna-top-selling-canned-foods-in-america/111338376/
- https://pubmed.ncbi.nlm.nih.gov/30770169/
- https://www.fda.gov/food/food-labeling-nutrition
- https://www.fda.gov/food/food-labeling-nutrition/food-allergies
- https://www.foodallergy.org/resources/how-read-food-label
- https://www.fda.gov/food/consumers/how-cut-food-waste-and-maintain-food-safety
- https://www.usda.gov/media/blog/2013/06/27/you-toss-food-wait-check-it-out
Thanks in advance for your questions and comments on this Public Health Matters post. Please note that CDC does not give personal medical advice. If you are concerned you have a disease or condition, talk to your doctor.
Have a question for CDC? CDC-INFO (http://www.cdc.gov/cdc-info/index.html) offers live agents by phone and email to help you find the latest, reliable, and science-based health information on more than 750 health topics.