Where it warmed the most in the world

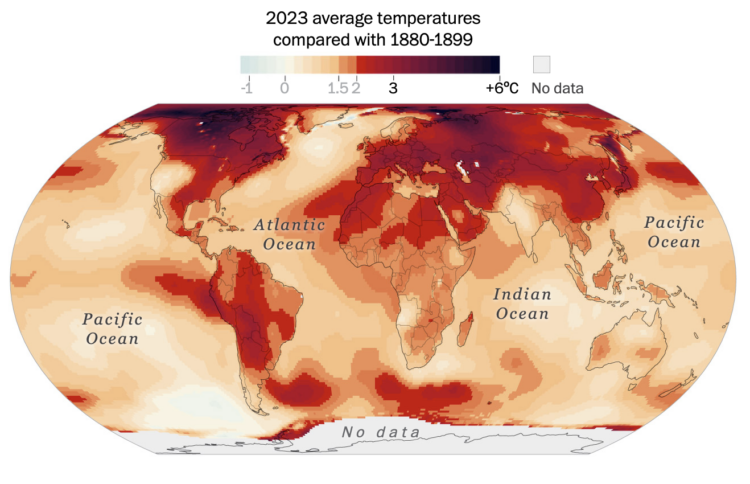
Earth got its hottest year on record in 2023. Based on data from Berkeley Earth, John Muyskens and Niko Kommenda, for The Washington Post, focused on the geographic areas that experienced the biggest jumps.

The Post has mapped the regions that saw the largest temperature anomalies in 2023 — places that have warmed so fast that the climate is already testing the limits of human infrastructure and the ability of the natural world to cope.

Tags: , ,

A hotter year, again

This year, 2023, was the hottest year on record. For Reuters, Gloria Dickie, Travis Hartman and Clare Trainor highlight the rising temperatures and the bad stuff that follows.

This year’s added warming has been like pouring gasoline on a fire. Extremes became more extreme. Warmer ocean waters fed stronger storms. Heatwaves persisted for weeks instead of days. And wildfires, feeding on dry forests and high temperatures, burned out of control.

An El Nino climate pattern, which emerged in the Eastern Pacific in June, is making things worse, scientists said. It’s boosting the warming caused by climate change, unleashing more catastrophic extremes.

Temperature extremes are still worth highlighting, but there are only so many ways to show an increase over and over again. Maybe someone can make a global warming exhibit that starts at the temperature highs of the 1800s and very quickly increases temperature to current highs. Throw in some VR with storms and wildfires.

Tags: , , ,

Cooling a city

Tall buildings in dense cities can trap heat and restrict air flow, which can make living in an area really hot. It’s worse when the environment as a whole is also warming. So Singapore is spending a lot to cool down their cities. For The New York Times, Pablo Robles, Josh Holder, and Jeremy White illustrate the measures Singapore has put in place.

I always appreciate the scrolly transitions from real life imagery with photos or video to the more abstract illustrations. It’s a good mechanism to keep concepts rooted in reality.

Tags: , , ,

Shifting towards more hot days, fewer cold days

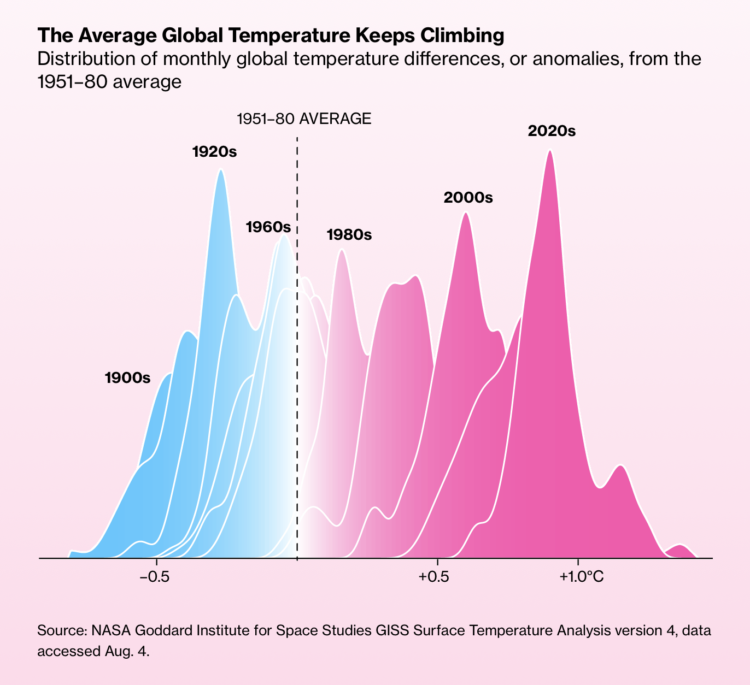
It keeps getting hotter around the world. Not every single day. But over time, there are increasingly more hot days and fewer cold days.
For Bloomberg, Zahra Hirji, Rachael Dottle and Denise Lu lean into layered density plots to show the shift and the path towards extreme climates.

They show distributions, which can be a challenge for non-data people to understand. So they take their time in the beginning to explain what the chart type shows, with a combination of color, animation, and labeling that stays consistent through the article.

Tags: ,

Losing ice in the Antarctic

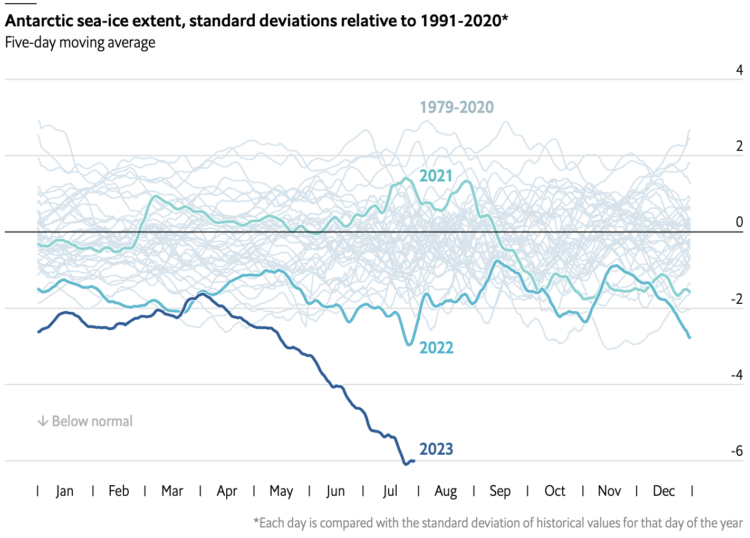
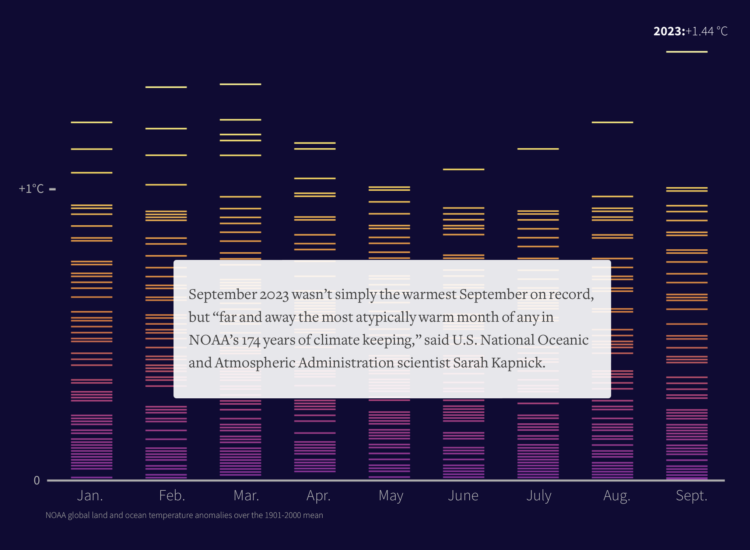
In this chart from The Economist that shows ice extent from 1972 up to present, that falling line for 2023 looks not good.

Tags: , , ,

Mapping the probable heat around the world

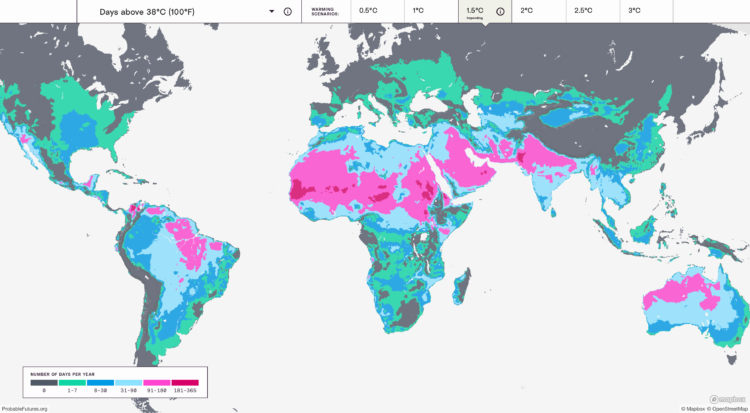
Earth is getting warmer, and the previously abstract concept seems to grow more concrete every day. Probable Futures mapped increasing heat, decreasing cold, and shifting humidity under different warming scenarios.

You have the global view shown above, and then when you zoom in enough, you can click on grid cells for the model estimates. Dots on the map point to a handful of short stories on how warming has changed daily life, which I feel like could use more attention.

Next to the zoom navigation buttons is a camera button, which lets you download the view that you’re looking at. This feature is probably new to me but has been around a for a while. I like it.

Tags: , , ,

Reducing methane to slow climate change

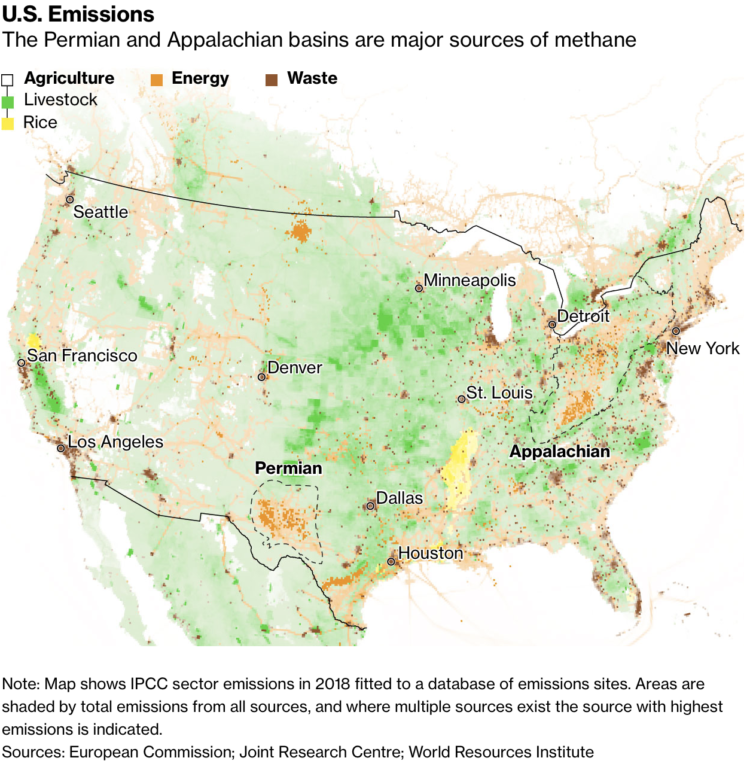
We often hear about increased CO2 in the context of global warming. Hayley Warren and Akshat Rathi for Bloomberg show why we should talk more about methane:

In the fight against global warming, methane has flown under the radar for too long. But there’s increasing recognition that tackling the invisible, odorless gas is one of the easiest, cheapest, and most feasible ways to make a real difference in slowing climate change. It’s the rare climate problem with a fix that can be felt by those alive right now, not their great-grandchildren.

Tags: , ,

Global warming color stripes, as decorative conversation starter

Ed Hawkins, who you might recognize from charts such as spiraling global temperature and the aforementioned temperature grid, encourages you to show your stripes. Select your region, and see how average temperature increased. I saw this last year, but I just realized that people are using this chart to print, knit, and decorate.

Emmalie Dropkin made a blanket:

Pueblo Vida Brewing and the University of Arizona Climate Systems Center used a variation of the stripes to decorate beer cans:

Gwyneth Matthews made earrings:

Hawkins also has a Zazzle store of his own, and of course there’s a face mask now:

Amazing what a few stripes can do. Check out the temperatures for your own region.

Tags: , , ,

Climate change displayed, with shower tiles

Based on a chart by Ed Hawkins, the shower wall of Gretchen Goldman and Tom Di Liberto transformed into a canvas to show global warming.

Each row represents a country, and each cell — I mean tile — represents the temperature difference compared to the overall average for the time period.

Tags: , , ,

How much warmer your city will get

BBC News asks a straightforward question: How much warmer is your city? Enter your country and then your city. You get a time series along with projections. It reminds me of The New York Times piece from a few years ago, but the BBC one uses more recent data and covers major cities worldwide.

Tags: ,