Algorithmic rent increase

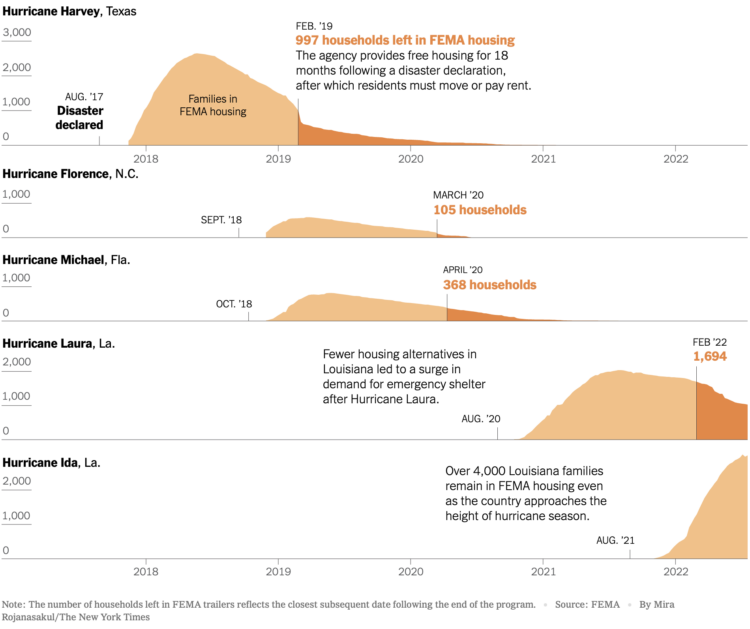
It’s growing more common for landlords to use software to set the rental prices of their properties. This of course leads to software companies promising optimized pricing for maximum profit, which leads to higher rent for residents. Heather Vogell, Haru Coryne, and Ryan Little, for ProPublica, look closer at the practice, with a focus on pricing company RealPage:

To arrive at a recommended rent, the software deploys an algorithm — a set of mathematical rules — to analyze a trove of data RealPage gathers from clients, including private information on what nearby competitors charge.

For tenants, the system upends the practice of negotiating with apartment building staff. RealPage discourages bargaining with renters and has even recommended that landlords in some cases accept a lower occupancy rate in order to raise rents and make more money.

One of the algorithm’s developers told ProPublica that leasing agents had “too much empathy” compared to computer generated pricing.

Oh.

Tags: , , ,

Housing market cooldown

I heard you like spiral charts when the data is seasonal. I think that’s what Kevin Schaul and Hamza Shaban, for The Washington Post, had in mind when they charted housing demand through the lens of percentage of houses sold within two weeks.

Tags: ,

Housing displacement after disasters

Christopher Flavelle, for The New York Times, reported on the lack of support from the Federal Emergency Management Agency for those who were displaced by natural disasters. Area charts by Mira Rojanasakul show how much the support has been lagging.

Tags: , , ,

Country-wide housing shortage

Emily Badger and Eve Washington for NYT’s The Upshot show how the housing shortage, which was mostly thought of as a west and east coast problem, has grown into a country-wide problem. The tables that compare metro areas between 2012 and 2019, while the most simple, are the most informative in this piece.

Tags: ,

Investors bought up a lot of houses in 2021

Home prices in the U.S. increased dramatically over the past couple of years. The percentage of home purchases by investors rather than future home owners also increased. For The Washington Post, Kevin Schaul and Jonathan O’Connell examined how much these percentages increased in major metro areas. In some places, over a third of home purchases went to investors.

Tags: , ,

Calculating where you should live

Choosing a place to live is always full of trade-offs, but it’d be nice if there was a way to minimize those trade-offs. For NYT Opinion, Gus Wezerek and Yaryna Serkez, made a calculator that lets you weight your priorities to find the city that fits best with how you want to live:

Places can score zero to 10 points for each metric. To calculate each place’s match percentage, we add up its scores across metrics that a reader has selected and divide by the total number of possible points. If a reader selects the checkboxes for trees and mountains, a place with a score of 6 for trees and 8 for mountains will be a 70 percent match.

Places with no data for a metric receive zero points. For starred metrics, we double the number of points scored and available to make them count twice as much toward the match percentage.

Read more on their methodology here. The interactive is based on data from the Census Bureau, Realtor.com, AccuWeather, and Yelp.

After checking the boxes that are important to you, you get a list of cities that best fit the criteria, based on an aggregated match percentage.

I found this is also an excellent way to feel less sure about your current residence and to wonder why areas that you thought would strongly dislike appear at the top of the list.

Tags: , , ,

Where America is expanding in developed areas

Zach Levitt and Jess Eng for The Washington Post mapped newly developed areas in the contiguous United States, between 2001 and 2019:

Between 2001 and 2019, the built-up landscape of America — buildings, roads and other structures — has expanded into previously undeveloped areas, adding more than 14,000 square miles of new development across the contiguous United States — an area over five times the size of Delaware.

My favorite part is the interactive map, which lets you see development in your area. The purple indicating newly developed areas against the grayscale provides a quick reference.

The maps are based on data from the United States Geological Survey, which you can grab here.

Tags: , , ,

Maps of migration to smaller cities

Steven Bernard for Financial Times, in a report by Claire Bushey and Steff Chavez, mapped net inflows (paywalled), based on property searches on home listing site Redfin. This shows a slightly different angle from NYT’s analysis, which showed less change year-over-year.

Tags: , ,

Racist housing policy from 1930s and present-day temperature highs

Brad Plumer and Nadja Popovich for The New York Times show how policies that marked black neighborhoods as “hazardous” for real estate investment led to a present-day with fewer trees and higher temperatures. The maps that shift back and forth between past districting and how things are now show the picture clearly.

This goes hand-in-hand with how tree-cover and neighborhood incomes are also tightly coupled.

Tags: , , ,