Change in consumer spending since the virus

Consumer spending has shifted dramatically since most people have to stay at home. For The New York Times, Lauren Leatherby and David Gelles show by how much:

All of the charts in this article are based on a New York Times analysis of data from Earnest Research, which tracks and analyzes credit card and debit card purchases of nearly six million people in the United States. While the data does not include cash transactions, and therefore does not reflect all sales, it provides a strong snapshot of the impact of the virus on the economy.

The article also includes breakdowns for the main categories above. The only reason restaurants and entertainment aren’t down more is because delivery services and at-home streaming slightly offset the dip.

Tags: , ,

Bloomberg ad spending, relative to other candidates’

Mike Bloomberg’s ad spending might not be that much relative to his own net worth, but compared to other candidates’ spending, it’s a whole lot of money. The Washington Post puts the spending into perspective with a long scroller. Each rectangle represents $100k, and there are “mile markers” along the way to keep you anchored on the scale.

Tags: , , , ,

Paying for Elizabeth Warren’s proposed policies

Elizabeth Warren has big plans, and they would cost a lot with a big shift in government spending. The New York Times breaks it down.

I realize the topic here is important, but NYT’s bubble game is on point in this piece. Check out those transitions as the bubbles funnel into the screen from the top and how the pie-like segments rotate as each segment is highlighted.

Force-directed graphs, for the win, amirite.

Tags: , ,

$16.1m in political and taxpayer spending at Trump properties

ProPublica compiled spending data from a wide range of sources to calculate the total, which is still an undercount:

The vast majority of the money — at least $13.5 million, or more than 84 percent of what we tracked — was spent by Trump’s presidential campaign (including on Tag Air, the entity that operates Trump’s personal airplane). Republican Senate and House political committees and campaigns have shelled out at least another $2.1 million at Trump properties. At least $400,000 has been spent by federal, state and local agencies. (For example, the Florida Police Chiefs Association held its summer conference last year at the Trump National Doral Miami.) The state and local tally appears to be a gross undercount because of the agencies’ spotty disclosures and reporting.

Messy headed into the presidency and messy still.

Catch the interactive visualization by ProPublica and Fathom Information Design. It shows the available records in more detail, and you can download the data for yourself.

Tags: , , , ,

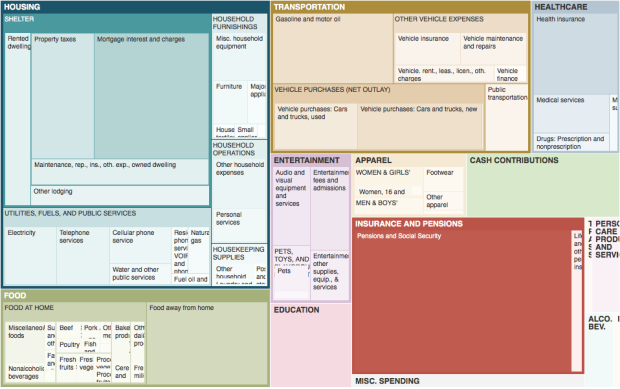
How Different Income Groups Spend Money

After living expenses, where does the money go, and how does it change when you have more cash available? Read More

Ad spending for Clinton and Trump

Ad spending for Clinton and Trump

Adam Pearce for the New York Times charted ad spending for Clinton and Trump, starting 20 weeks out from the election up to present. I like the John McCain, Mitt Romney, and Barack Obama spends as a point of reference.

Tags: , , ,

We spend more at restaurants than at grocery stores

For decades, Americans spent more money at the grocery store than at eating and drinking establishments. It’s not like that anymore, Quartz reports.

Restaurant spending

Tags: , ,

School district spending per student

Spending per student in the US

NPR is running a series on spending and school districts and all its complexities with government funding and whether or not more money even helps. They start with a map that shows the differences in spending per student in primary and unified school districts. Dollars are “adjusted for regional differences in cost of living, using the NCES Comparable Wage Index 2013.”

As you scroll down the story, an interactive map pans to the geographic area you’re most likely located in. It’s a small thing that we’ve been seeing more of lately. Since users are most likely to zoom in to their own area to compare, might as well try to do it for them. I like it.

Tags: ,

How We Spend Our Money, a Breakdown

We know spending changes when you have more money. Here's by how much.

Spending

Continue reading →