Life expectancy by state, against the US average

FiveThirtyEight continues their look at mortality by geography. This graphic by Anna Maria Barry-Jester compares life expectancy over time for each state. Purple means below average and orange means above.

The good news is that all the lines trend upward. The bad news is that some states are trending upwards much more slowly than the rest.

Tags: , ,

Small multiples for NBA game differentials

Point differentials

Adam Pearce charted minute-by-minute point differentials for NBA games during the 2014-15 season.

To squeeze distribution in, I had to make a couple of trade offs. Instead of being able to encode point differentials with vertical position like I did with my Golden State's win streak chart, I used color for point difference and saved vertical position for distribution. Since there have been more score differences (GSW was beating by MEM 52 at one point) than can be usefully encoded as unique colors, I bucketed the score differences into 7 colors.

Nifty.

And go Warriors.

Tags: ,

Linked Small Multiples

Small multiples are great, and the right interactions can make them even better. A primer and a how-to.

Linked Small Multiples

Continue reading →

California drought in small multiples

LA Times - California drought

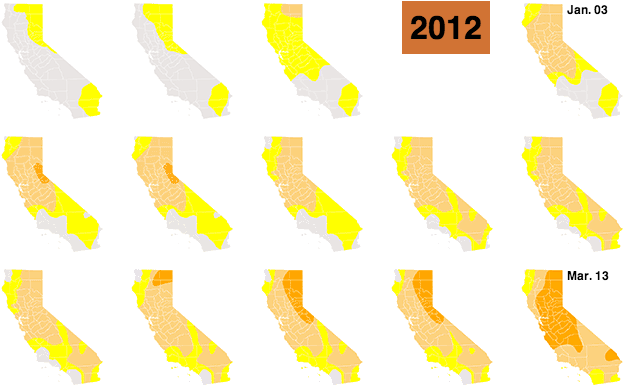
To show the increased levels of drought throughout the state of California, Kyle Kim and Thomas Suh Lauder for the LA Times showed weekly change in drought levels with 188 color-coded California maps. There's also an animated version, but why do that when you can scrollllll?

A couple of years ago, the New York Times did something similar, but with a two-category color scale and on a national scale.

Tags: , ,