Grid map shows shifting states

Time series grid map

You’re likely familiar with the state grid map form used these days. Instead of using geographic boundaries, you place states in a grid layout, giving an equal-sized cell to each state so that they all get the same visual weight. The Wall Street Journal combined it with a time series for each state in their field guide to shifting states.

The country is more than just red states and blue states. Some former battlegrounds have moved to the sidelines. Other once reliably Republican or Democratic states have come into play as the composition of their electorates change.

Red means more Republican than the national popular vote, and blue means more Democrat.

The slow, animated load makes the map. It reminds me of the New York Times’ “wind” map from the previous election. Life-like.

Tags: ,

Ride on the VR time series roller coaster

VR Nasdaq

Speaking of virtual reality visualization, this Nasdaq roller coaster by Roger Kenny and Ana Asnes Becker for the Wall Street Journal is quite the ride. The underlying data is just the index’s price/earnings ratio over time, but you get to experience the climbs and dips as if you were to ride on top of the time series track.

Weeeeeee, bubble burst.

Tags: , ,

Gender pay gaps for major U.S. occupations

Pay gap

As we all know these days, there exists a gender pay gap across most major professions in the United States. The Wall Street Journal charts the average differences for 446 occupations.

Occupations are charted from least to greatest gap horizontally, and the vertical axis represents salaries. Blue dots represent men’s average salaries and the pink represents women’s, and a vertical line connects the two. So the longer the vertical, the bigger the gap.

There’s an interesting use of the fish eye effect as you mouse over so that you can see the individual lines. There’s also a search box to find an occupation of interest. I just wish the two were closer linked with a zoom on search, instead of only a highlight.

Tags: , ,

Imagining alternative iPhone power sources

Fat battery

Lithium-ion batteries power the iPhone (among other things), but what if we could use a different power source like coal or diesel? With some back-of-the-napkin math, Jon Keegan for the Wall Street Journal imagines what if. It's all about the body fat-powered iPhone with nine days of battery life.

Tags: , ,

Be a tennis line judge: Interactive tests your skills

Tennis line judge

The job of a tennis line judge can be though when you have to judge the difference of a few millimeters as a ball speeds by. Sure, it's easy to complain about bad calls at home, where we get to see replays in slow motion, but it's more challenging in real life. The Wall Street Journal provides a bit of the experience with an interactive game. Watch video clips from a line judge's point of view, and try to make the right call.

Tags: , ,

Color timeline for Avengers comic book covers

Avengers comic book covers

The Avengers comic has been around since 1963 and the look and feel of characters have changed over the years. Jon Keegan for the Wall Street Journal looked at this change through color usage in the comic's covers.

A zoomed out timeline shows all the cover colors at once, the middle strip shows a zoomed in view, and a click on each row shows the full cover.

If you scan from 1963 down to the present, you can see a subtle shift from simple primary colors to a more complex palette.

However, there's a lot of variation on a cover-by-cover basis, and I'm not sure if I would pick up on the change if I didn't know what to look for. Maybe an annual aggregation to reveal more of pattern? I also expected to click the overview timeline or drag the highlighting square to quickly move through the covers, but you can only navigate by scrolling the page.

In any case, should be a fun browse for the comic book fans.

Tags: , , ,

Impact of vaccines throughout history

Vaccination and cases

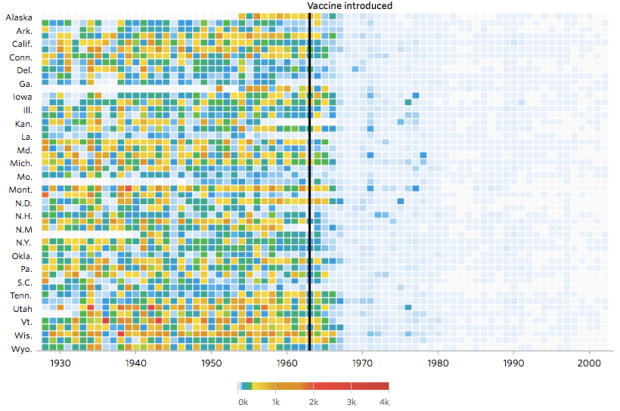
Not that anyone who does not vaccinate their kids cares, but Tynan DeBold and Dov Friedman for the Wall Street Journal show the change in number of cases for various diseases after a vaccination is introduced.

Each row represents a state, and each column represents a year. So each cell represents the number of cases per 10,000 people, in a state for a given year. The above shows the change for measles cases, which you can see a quick rate decrease after the introduction of the vaccination in 1963.

I'm not sold on the color scheme, which seems arbitrary with six shades from minimum to maximum. Saturation only changes at the low rates likely used to accentuate the drop after a vaccine. However, as you mouse over cells in each grid, an indicator appears in the legend to show where the rate is in the color scale, so they can kind of get away with it.

Kinda like it, kinda don't. Still important information.

Tags: ,

Job gains and losses over time

Sector tracker

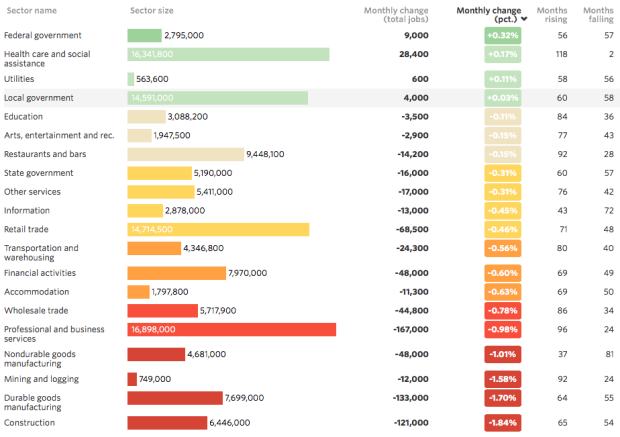
Andrew Van Dam and Renee Lightner for the Wall Street Journal provide a couple of useful linked views of unemployment and job gains and losses. The former comes as a grid where each cell represents the unemployment rate, and the standard time series is shown below that.

The second view is the more interesting part. It shows job gains and losses for various sectors (above), where each dot represents a sector and each column represents a year. Mouse over a sector to see how it did each year, and click on a year for a more detailed view like the breakdown below.

Annual changes

Or come at it from the other side and interact with the detailed view and see how it relates to the overview.

Easier to explore on your own than for me to describe.

Tags: ,