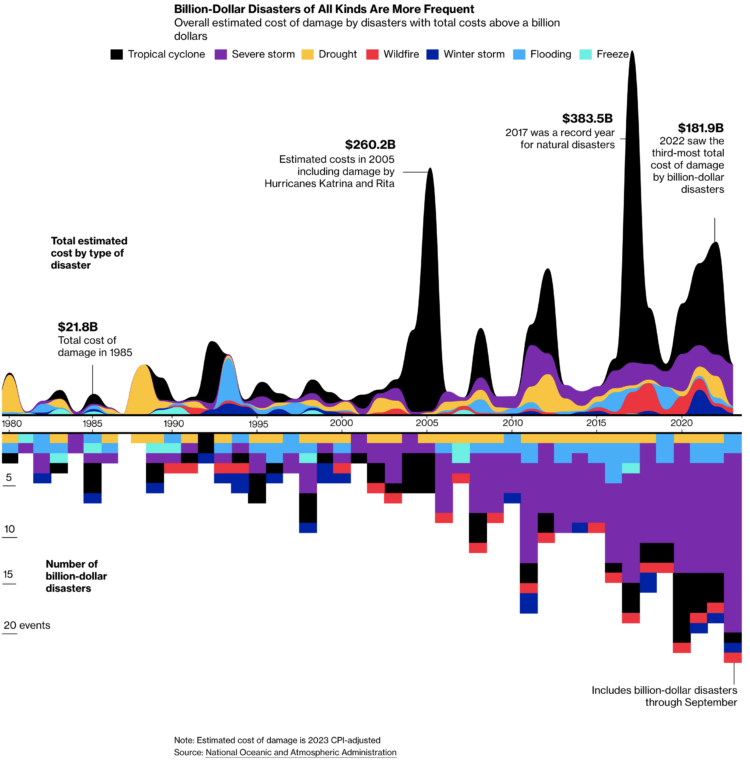
Billion dollar natural disasters

For Bloomberg, Rachael Dottle and Leslie Kaufman go with the combo stacked area chart and stacked bar chart on the top and bottom to show increased cost of billion dollar disasters and the counts over time. It looks like the sporadic tropical cyclones are causing the most damage.

Tags: , , ,

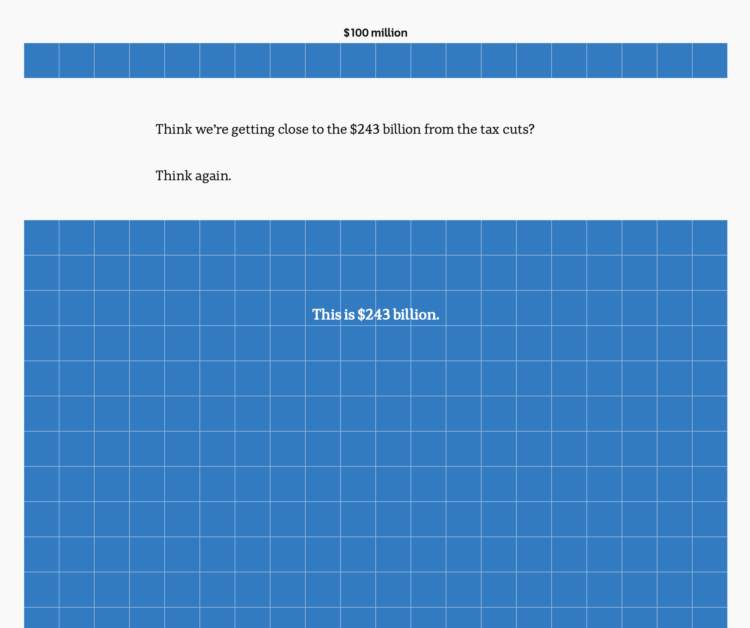
Scale of billions of dollars in Australia’s budget

To show the scale of tax cuts and Australia’s budget, ABC News takes the long, vertical unit chart approach, and the squares just keep coming. This is one of those scrollers that works best on mobile.

Tags: , ,

Federal budget scaled to per person dollars

For The Upshot, Alicia Parlapiano and Quoctrung Bui scaled down the federal budget to something more relatable:

To better understand how federal spending has changed since Mr. Trump has taken office, we looked at the actual budget amounts for the 2020 fiscal year. We divided them by the U.S. population and sized the numbers proportionally to make their scale easier to visualize. Then we compared the numbers to the actual budget for the 2016 fiscal year, adjusting for inflation and population changes.

Federal budget visualizations usually aim to show big dollar values going to many different departments. You look at the breakdowns, and you can’t help but think, “That’s a lot of money.” For most of us, it’s hard to imagine billions of dollars, because the scale is so far beyond our own experiences.

So it’s interesting that this piece goes the other direction and scales everything down to match the values to something more familiar. The font size of each value also scales accordingly, which I think in the end is what you end up focusing on.

Tags: , , , ,

Searchable budget proposal and the 10-year change

The administration released a budget proposal yesterday, which as you’d expect contains some big shifts. The New York Times calculated “the changes over 10 years, compared with projected spending under current law” and made the numbers available in a searchable table.

Tags: ,

Shifting national budget

The Washington Post looks at the shifting national budget over the past 40 years. Be sure to keep scrolling past the first overall to see the funding for departments separately. The consistent vertical scale works well.

Tags: , ,