Catching students cheating with R

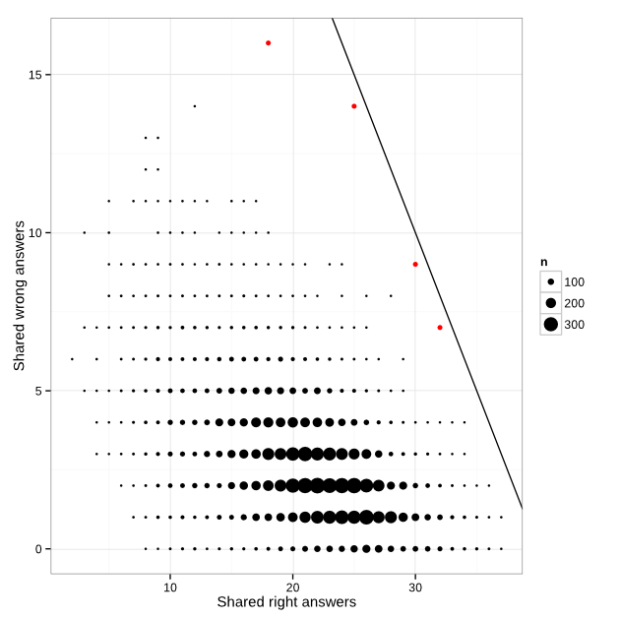
Matthew Crump, a psychology professor who discovered high volume cheating in his class via WhatsApp, outlines the saga in five parts. Bonus points for use of R to analyze the evidence:

I do a lot of teaching on using computational tools for reproducible data analysis. I can input some data and run it through a script for analysis. When the data changes I can run it through the same script and get the new analysis. The chat archive had changed and this time it was easier to do the analysis all over again. I redid all the counts of academic integrity violations and rewrote the forms spelling out sanctions for each student. So many forms, I died a little inside once for every form.

Tags: , , ,

Possible cheating seen in a scatterplot

When plotting Russian election results, a structured grid patterns appear. From The Economist:

When Dmitry Kobak and Sergey Shpilkin, two researchers, analysed the results, they found that an unusually high number of turnout and vote-share results were multiples of five (eg, 50%, 55%, 60%), a tell-tale sign of manipulation. According to Messrs Kobak and Shpilkin, there were at least 1,310 polling stations (out of 96,325) with results that were suspiciously tidy, with rounder numbers than you would expect to see by chance.

I’m not familiar with Russian elections, but this seems like lazy cheating. Are they just making up numbers by hand or what?

Check out the full results of Kobak and Shpilkin’s analysis in Python notebook form.

Tags: , ,

Identifying cheaters in test results, a simple method

Finding cheaters

Jonathan Dushoff had issues with students in his population biology class cheating on his exams. One year there was suspicious behavior, but Dushoff and the proctors weren't able to prove the students cheated as it happened. So he looked closely at the test results to find the guilty students.

The final is entirely multiple choice. I got the results files from the scantron office. I figured that I wouldn't quite know what to do with a comparison just between these two kids (unless the tests were identical), and that it would be just about as easy (and far more informative) to compare everybody to everybody else. It's still kind of hard for me to get used to the fact that we have computers now and can really do stuff like this. I calculated the number of identical right answers and the number of identical wrong answers for each pair of students (~18K pairs), and plotted it out.

The diagonal line indicates two students who had the exact same wrong and right answers. No pair of students did this, but there were four outlying pairs that got close, shown in red. And looking back at the seating arrangements, in a class of 200 students, all four pairs were students who sat adjacent to each other.

Dushoff has since gone back to multiple exam versions.

Tags: ,