Nuclear winter explained visually

Neil Halloran, known for his documentary films that lean strongly on data visualization, collaborated with RAND to explain the possibility (or lack) of a nuclear winter. In the last third of the film, Halloran also discusses the pursuit of absolute truth and whether it’s truly worth it in the end. Lots to think about.

Tags: , ,

Nuclear energy rebrand

Nuclear energy has bad memories linked to it, which tends to draw fear from the general public. Harry Stevens, for The Washington Post, explains why some feel the fear is unwarranted:

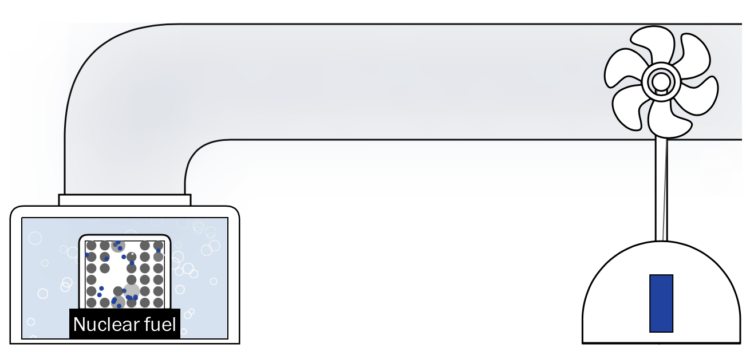
This explanation vastly oversimplifies a great deal of sophisticated engineering. However, the basic concept of a steam-powered electricity plant had been worked out by the late 1800s. “The only thing the 20th century gave us was a new way to make steam by heating it with nuclear fission,” said James Mahaffey, a retired nuclear engineer who has written several books on nuclear energy.

The piece includes cartoon circles with eyes to describe a fission chain reaction. Classic Stevens. Stevens should include cartoon eyes in every piece he makes for his own bit of branding.

Tags: , ,

Reducing the risk of nuclear war

For Our World in Data, Max Roser discusses the risk and possible destruction of nuclear war, along with suggestions on how to reduce that risk:

An escalating conflict between nuclear powers – but also an accident, a hacker, a terrorist, or an irresponsible leader – could lead to the detonation of nuclear weapons.

Those risks only go to zero if all nuclear weapons are removed from the world. I believe this is what humanity should work towards, but it is exceedingly hard to achieve, at least in the short term. It is therefore important to see that there are additional ways that can reduce the chance of the world suffering the horrors of nuclear war.

Tags: , , ,

Nuclear war is on the ballot

Neil Halloran, creator of the interactive World War II documentary focused on deaths, is working on another focused on the cost of nuclear war. With the election tomorrow, Halloran pushed out an “election cut” to highlight what’s at stake. Very scary.

Tags: ,

Nuclear detonations from 1945 to present

There have been over 2,000 nuclear detonations since 1945. Orbital Mechanics mapped each documented test in animated form. It's mostly about mood and the individual explosions. More journal-like, although not much annotation unfortunately.

Red represents atmospheric explosions, yellow represents underground, and blue represents underwater.

See also artist Isao Hashimoto's rendition from a few years ago. It's the same data with an entirely different feel.

[via kottke]

Tags: , ,