Interactive traffic simulator

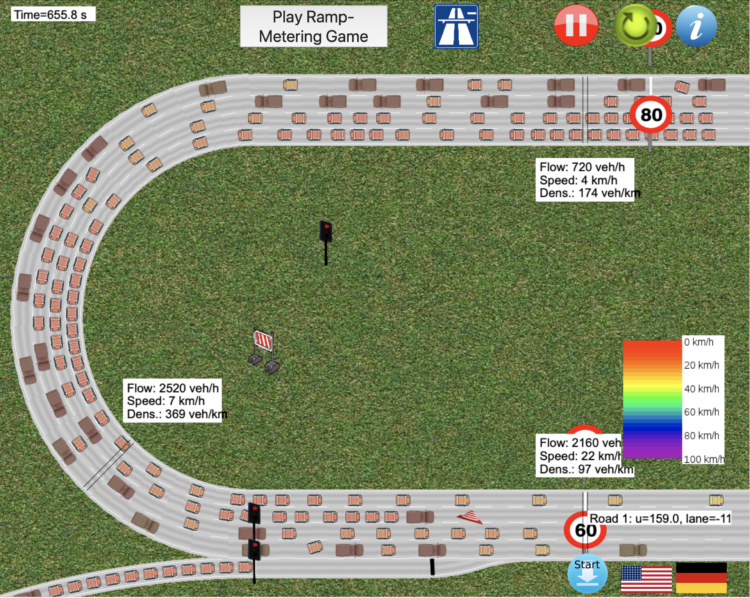
Traffic always seems so sensitive to the smallest disruptions. Someone pulls over to the side of the road? Traffic jam. Slight incline on the freeway? Traffic jam. One person weaving in and out of lanes? Traffic jam. With this traffic simulator by Martin Treiber, you can test out all the possible scenarios.

You can use different types of roads, place speed limits, start construction, increase or decrease the number of lanes, adjust the incline, and even define politeness among drivers. Experience the frustrations of driving, right from your computer. [via kottke]

Tags: , ,

Change in foot traffic in outbreak cities

From The Economist, this chart shows the (mostly) decrease in foot traffic in major cities with coronavirus outbreaks. It’s based on data scraped from that section in Google Maps that shows how busy a location is, which I’m kind of surprised the Google limits allowed for. See James Fransham’s thread for more details on their process.

Tags: , , ,

Faking traffic on Google Maps with a wagon of 99 smartphones

Google Maps incorporates data from smartphones to estimate traffic in any given location. Artist Simon Weckert used this tidbit to throw the statistical models off the scent. With a wagon of 99 smartphones, he turned roads red on Google Maps just by walking around.

Nice.

Tags: , , ,

Data for 200M traffic stop records

The Stanford Open Policing Project just released a dataset for police traffic stops across the country:

Currently, a comprehensive, national repository detailing interactions between police and the public doesn’t exist. That’s why the Stanford Open Policing Project is collecting and standardizing data on vehicle and pedestrian stops from law enforcement departments across the country — and we’re making that information freely available. We’ve already gathered over 200 million records from dozens of state and local police departments across the country.

You can download the data as CSV or RDS, and there are fields for stop date, stop time, location, driver demographics, and reasons for the stop. As you might imagine, the data from various municipalities comes at varying degrees of detail and timespans. I imagine there’s a lot to learn here both from the data and from working with the data.

Tags: , ,

Coral-like cities to show road networks

Craig Taylor from Ito World used a coral metaphor to visualize road networks in major cities around the world:

For the past six months I have been fascinated by the concept of making city networks look like living corals. The varying patterns of urban forms are inherently dictated by their road network; a complex, seemingly organic connection of links moving people across their city. Like branches of coral they have a pattern and a function, I chose to expose this pattern and manipulate it to become something far more conceptual. However, whilst being incredibly beautiful they are derived from various geo-spatial analysis of drive-times catchments making them somewhat informative as well.

Pretty.

Tags: ,

Speeding increases energy in a crash proportional to the square

A car moving at 70 miles per hour has to stop suddenly. Another car going 100 miles per hour also has to stop suddenly. Your intuition might say that the former requires 30% less energy to stop, but the energy required is actually proportional to the square of the velocity. Ben Sparks for Numberphile explains:

Okay. Now what are the energy gains and losses for the guy trying to speed by weaving in and out of slow traffic?

Tags: , ,

Traffic fatalities data for 2015 released

Crashes by road type

Each year, the National Highway Traffic Safety Administration releases data for traffic accidents that resulted in deaths. I briefly looked at the data a while back. Others did too. For years, there have been fewer deaths than the year before, but the 2015 data shows a 7.2 percent increase.

So, the NHTSA released the data earlier this year and, along with the White House, formally reached out to the data community to analyze the data.

DOT is aggressively seeking ways to improve safety on the roads. From our work with the auto industry to improve vehicle safety, to new solutions to behavioral challenges like drunk, drugged, distracted and drowsy driving, we know we need to find novel solutions to old challenges.

We’re also looking to accelerate technologies that may make driving safer, including connected and highly automated vehicles.

But we need your help, too! Data Science is a team sport.

Yes.

Tags:

Avoid busy times at local businesses with Google

Avoid busy times

Waiting in line stinks. I purposely go to the grocery store during off-times with my son, so I don't have to deal with the long lines. Google, I think currently only on Android phones, now provides information on when people go to the businesses around you, using a similar logic to auto traffic on Google Maps. Nice.

Tags: , ,

Traffic gridlock simulation

Gridlock and Bottlenecks

I hate all things commute- and traffic-related, and it's probably why I like to learn about what makes commutes painful. Maybe if I know more about what's happening, I won't get so frustrated when I have to drive.

Transportation engineering PhD candidate Lewis Lehe has a look at bottlenecks and gridlock, creating simulations of both. The former is when too many cars want to do the same thing at once, like enter at a freeway entrance. Gridlock is when a bottleneck in one direction causes a bottleneck in the other direction, and then the same happens the other way around, starting a horrible, horrible cycle.

Tags: , , ,