easystats, an R package

The easystats R package in on my to-try list.

easystats is a collection of R packages, which aims to provide a unifying and consistent framework to tame, discipline, and harness the scary R statistics and their pesky models.

Apparently it’s been around since 2022, but it’s new to me.

Tags: ,

Posted by in Coding, package, R

Tags: ,

Permalink

R packages useful for sports analytics

If you’re into R and analyzing sports data, you’ll want to save this CRAN task view:

This CRAN Task View contains a list of packages useful for sports analytics. Most of the packages are sport-specific and are grouped as such. However, we also include a General section for packages that provide ancillary functionality relevant to sports analytics (e.g., team-themed color palettes), and a Modeling section for packages useful for statistical modeling. Throughout the task view, and collected in the Related links section at the end, we have included a list of selected books and articles that use some of these packages in substantive ways. Our goal in compiling this list is to help researchers find the tools they need to complete their work in R.

Tags: , ,

Colors for All, R package

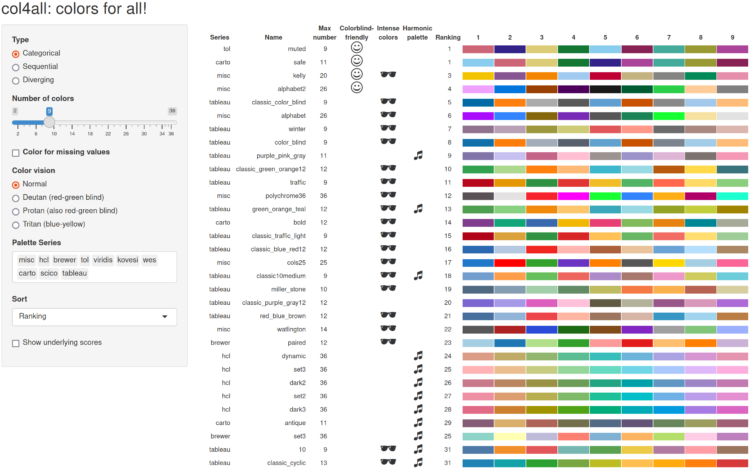
If you use color as a visual encoding, you should make sure every one can actually see the differences in your scale. The cols4All package from Martijn Tennekes can help by ranking and categorizing a wide set of color schemes.

Color palettes are well organized and made consistent with each other. Moreover, they are scored on several aspects: color-blind-friendliness, the presence of intense colors (which should be avoided), the overall aesthetic harmony, and how many different hues are used. Finally, for each color palette a color for missing values is assigned, which is especially important for spatial data visualization. Currently we support three types: categorical (qualitative) palettes, sequential palettes, and diverging palettes. In the near future, more palette types will be added, such as cyclic, bivariate, and hierarchical.

Tags: , , ,

Spike maps in R

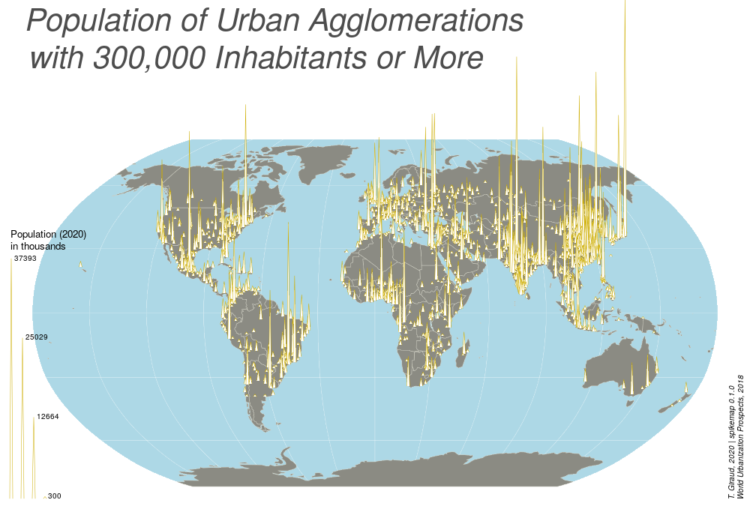
Spike maps use the height of spikes to encode data geographically. The format provides a similar effect to frequency trails where the layering looks 3-D-ish, except spikes are typically centered on an area instead of running parallel.

Anyways, like most visualization methods with a name, there is an R package for spike maps by Timothée Giraud.

If D3.js is your jam, there’s also a solution for that. You can also take the no-code route with Datawrapper.

Tags: ,

Posted by in Coding, package, R

Tags: ,

Permalink

Interpolate your data for animation in R

The tweenr package in R, by Thomas Lin Pedersen, helps you interpolate data for easier animated transitions.

tweenr is a small package that makes it easy to interpolate your data between different states, specifying the length of each change, the easing of the transition and how many intermediary steps should be generated. tweenr works particularly well with gganimate but can be used for any case where interpolation of data is needed.

Why I’m just now learning about this, I have no clue. I thought we were friends.

Tags: , ,