Most common professional marriages

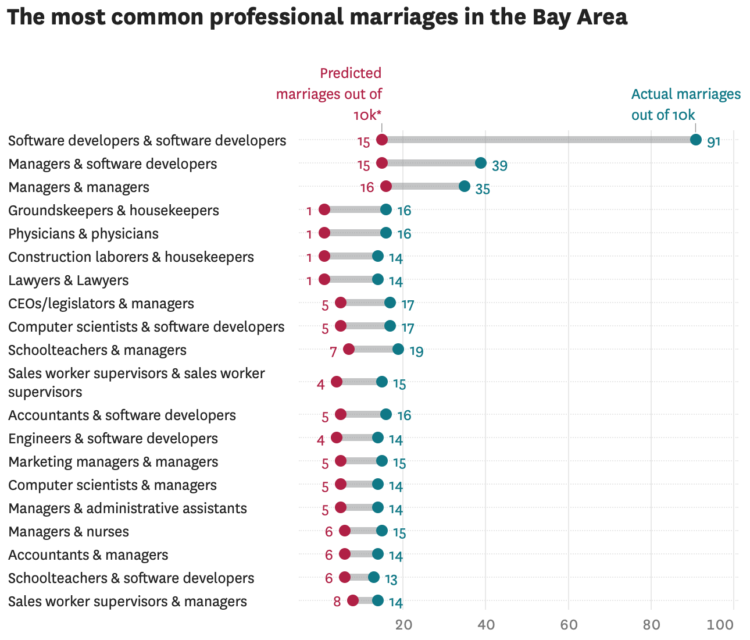
Susie Neilson for the San Francisco Chronicle compared the marriage of professions in San Francisco against the national average. As you might expect, there were a lot of programmers:

Perhaps unsurprisingly, the most common union between two professionals here is between a computer programmer and … another computer programmer. Our estimates show that an estimated 1% of all marriages in the region are between two software developers — specifically developers of applications and systems software. For the U.S. overall, software developer unions make up less than one-tenth of a percent of all marriages.

Back in 2017, I made similar comparisons nationally. I like this local angle. Also, maybe I should look at the most recent numbers.

Tags: , , ,

Who marries who, by profession

Marriage and jobs

People with certain professions tend to marry others with a given profession. Adam Pearce and Dorothy Gambrell for Bloomberg Business were curious.

When it comes to falling in love, it’s not just fate that brings people together—sometimes it’s their jobs. We scanned data from the U.S. Census Bureau’s 2014 American Community Survey—which covers 3.5 million households—to find out how people are pairing up.

You get a matrix of professions organized by more male to more female, left to right. Mouse over any profession or use the search box and lines project out to the five most common professions that the one of focus tends to marry to. The pink and blue color gradients indicate the sexes of the two spouses.

So for each profession, you get a quick view of who people marry, whether it be outside their own or within. I like how when you mouse over the far left or the far right, you see lines jut across to the opposite side. I wonder what the tendencies are in total for male-dominant to marry female-dominant professions and vice versa.

Tags: , ,

Quick change of mind on social issues

Pace of Social Change by Bloomberg

As Supreme Court hearings for same-sex marriage start today, Alex Tribou and Keith Collins for Bloomberg look back at timelines for past social issues, such as interracial marriage and abortion.

Each line represents an issue, and the height shows the number of states that removed the ban each year, so you end up with lines that increase slowly, and then there's a sudden jolt upwards that ends in federal action. Note the quick increase over just a few years with same-sex marriage. Marijuana legalization on the far bottom right is getting started.

Scroll down the page for more details on each issue, with moving lines that provide a sense of change and the now familiar gridded state maps filled over time.

Tags: ,

Interracial and same-sex marriage parallels

xkcd on Marriage

xkcd doing what xkcd does. Randall Munroe charts a brief timeline of interracial and same-sex marriage, through the lens of popular approval and population.

Tags: ,