
The Kansas City Chiefs beat the San Francisco 49ers in Super Bowl LVIII. That’s three championships for the Chiefs in the last five years. How does that compare to teams who won previous Super Bowls over the past 58 years?
Adam's Blogroll: click through to the author's blog
The Kansas City Chiefs beat the San Francisco 49ers in Super Bowl LVIII. That’s three championships for the Chiefs in the last five years. How does that compare to teams who won previous Super Bowls over the past 58 years?
Posted by in Data Underload, Football, Super Bowl
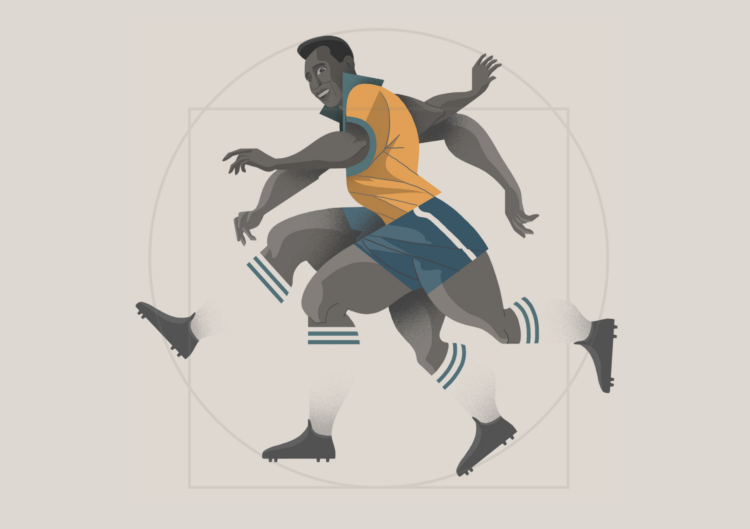
For South China Morning Post, Victor Sanjinez and Dennis Wong used a visual story to show why Pele was so great at football and in life. Illustrations mixed with a few charts makes for a good explanation of the-man-the-legend’s career.
Tags: football, Pele, South China Morning Post
Posted by in Football, Infographics, Pele, South China Morning Post
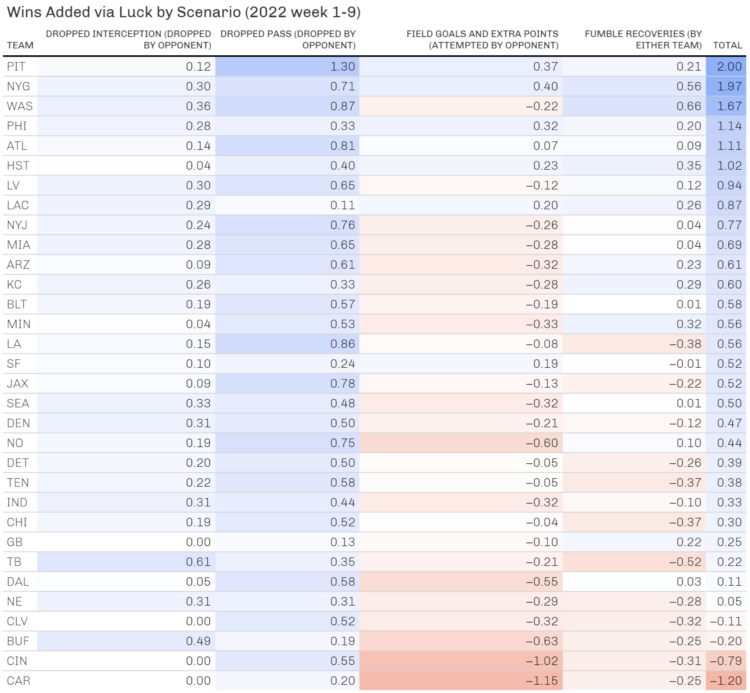
NFL Football Operations calculated how much luck has contributed to team wins and losses this season. They considered four actions that involve a lot of randomness: dropped interceptions, dropped passes, missed field goals, and fumble recoveries. Then they took the difference between expected win probability and the chances of the actions to calculate lucky wins and losses.
Normally I live in a football-free household, but someone joined a fantasy football league, which has a way of turning non-fans into obsessive stat checkers.
Tags: football, luck, randomness
Posted by in Football, luck, randomness, Statistical Visualization
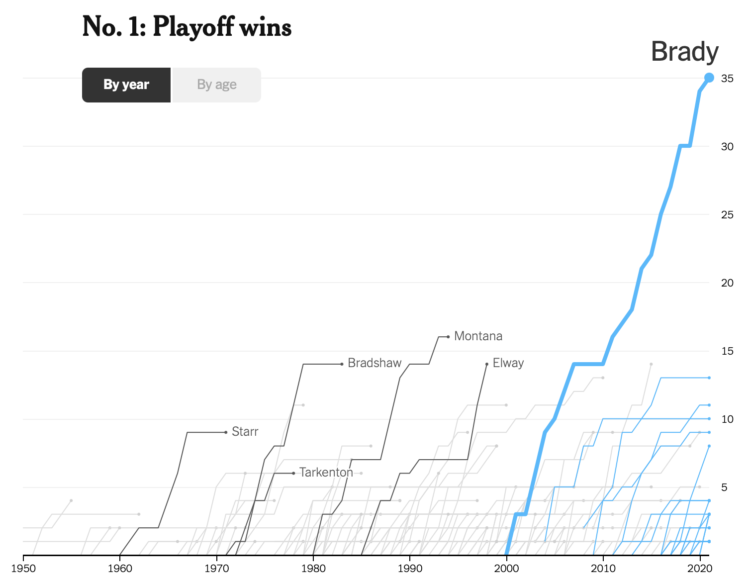
Tom Brady announced his retirement from the National Football League, which ends a long career that stands out from the rest. As required by law, when it comes to sports records over time, The Upshot made four line charts that show cumulative stats for Brady and his peers.
Posted by in Football, Statistical Visualization, Tom Brady, Upshot

For The Upshot, Kevin Quealy used a heatmap to visualize fantasy football draft picks:
This variance is widest for quarterbacks, whose pick patterns are so distinct you don’t even need to read their names to know they’re a quarterback. Chiefs quarterback Patrick Mahomes, named the N.F.L.’s most valuable player last season, represents the most obvious example of this pattern, with a roughly equal likelihood of being drafted in any of the first 40 picks in the draft, including No. 1 over all.
Tags: fantasy, football, Kevin Quealy, Upshot
Posted by in fantasy, Football, Kevin Quealy, Statistical Visualization, Upshot

Football season is starting soon, which means many will participate in the age-old tradition of the fantasy football draft. For the Washington Post, Neil Greenberg and Reuben Fischer-Baum have your back:
Your fantasy football draft sets a season-long foundation for your team, but its ultimate result will be based on the weekly performance of your roster. That’s why The Washington Post is adding weekly point projections (using PPR scoring) to its draft rankings, based on a player’s role in his team’s offense and the difficulty of the matchup.
Look at all the players or pick a position and quickly get the rankings.
Tags: fantasy, football, Washington Post
Posted by in fantasy, Football, statistics, Washington Post
Posted by in Football, Infographics, punt, SB Nation

Reuben Fischer-Baum for The Washington Post looks at professional football expectations given their draft picks versus performance.
By comparing how much value teams should get given their set of picks with how much value they actually get, we can calculate which franchises make the most of their draft selections. Approximate Value (AV), a stat created by Pro Football Reference that measures how well a player performed overall in a season, is useful here. Based on this metric, we find that the Browns draftees have underperformed in the NFL given their draft position, especially when compared to the draftees of a team like, say, the Seahawks.
My main takeaway is that teams seem to know what they’re gonna get. Overall at least. Save a few teams who outdid expectations and a few who failed pretty badly, everyone else sticks towards the baseline. But it’s also really random year-to-year, which is essentially what makes sports interesting.
See also the player-level comparison for professional basketball from last year.
And, just a random observation, it felt weird reading this sports piece with “Democracy Dies in Darkness” at the header of The Washington Post site. But maybe that’s just me.
Tags: draft, football, Washington Post
Posted by in draft, Football, Statistical Visualization, Washington Post

It’s always fun to go back to sports articles and graphics that were a lead-up to a game the day after. The newest addition: this graphic from The New York Times that shows wide receiver Odell Beckham Jr.’s catches this season. It shows route patterns, the catch, yards after the catch, and touchdown paths. If you’re not into football, just take it in as a small multiples example.
Tags: football, New York Times
Posted by in Football, Infographics, New York Times
In the latest addition to the put-big-numbers-in-context genre, here’s the history timeline of our planet in the context of 100 yards.
Tags: big numbers, football
Posted by in big numbers, Football, Infographics