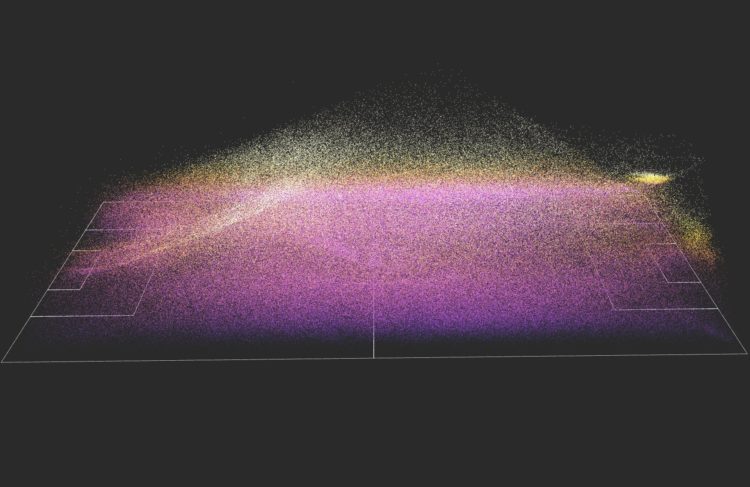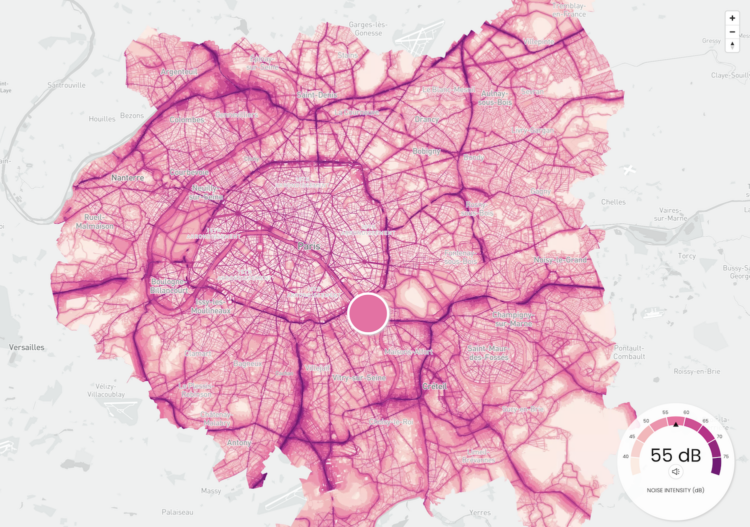
Karim Douïeb, in collaboration with Possible, mapped noise in Paris, New York, and London. The color on each map represents noise level, and if you have your sound on, you can mouse over areas to hear what noise might be like. The project, Noisy Cities, is an adaptation of Douïeb’s previous map of Brussels.
You get a good idea of what noise pollution is like geographically. All it needs now is a machine to blow varying levels of smog in your face.
Also something new I learned: the Department of Transportation has a transportation noise map that shows modeled noise levels nationally.
Tags: Karim Douïeb, noise, pollution