Visualization to better see true values in data

For Scientific American, Jack Murtagh describes the importance of visualization in understanding the roughness of data:

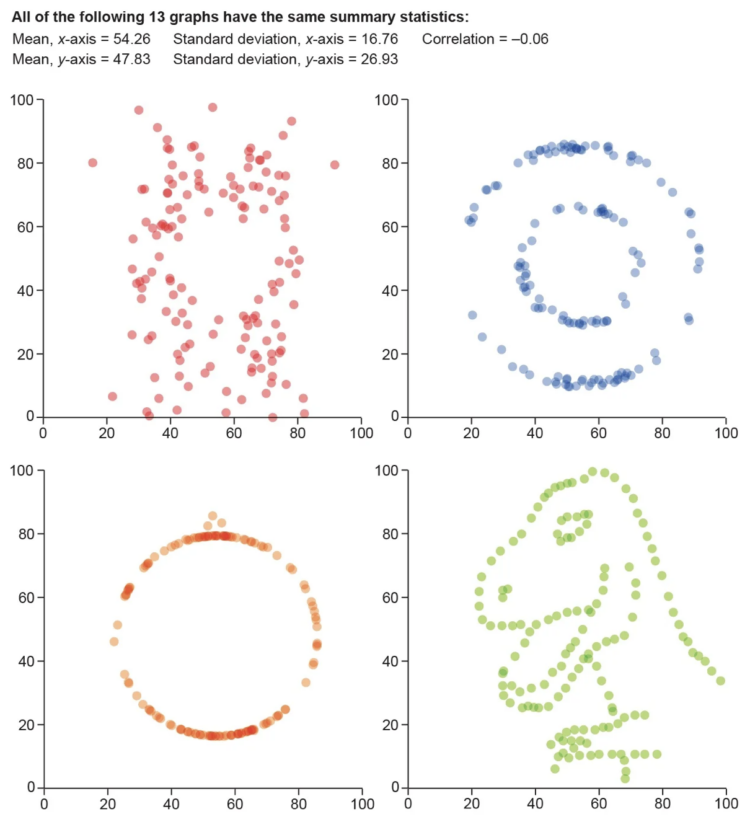
One maxim that should be etched into the walls of all scientific institutions is to visualize your data. Statistics specializes in applying objective quantitative measures to understand data, but there is no substitute for actually graphing it out and getting a look at its shape and structure with one’s own eyeballs. In 1973 statistician Francis Anscombe feared that others in his field were losing sight of the value of visualization. “Few of us escape being indoctrinated” with the notion that “numerical calculations are exact, but graphs are rough,” he wrote. To quash this myth, Anscombe devised an ingenious demonstration known as Anscombe’s quartet. Together with its wacky successor, the datasaurus dozen, nothing more dramatically communicates the primacy of visualization in data analysis.

Tags: , ,

Noise and health

The New York Times explores how noise impacts health:

Anyone who lives in a noisy environment, like the neighborhoods near this Brooklyn highway, may feel they have adapted to the cacophony. But data shows the opposite: Prior noise exposure primes the body to overreact, amplifying the negative effects.

I’m going to use this for the new reason my kids need quiet time.

Tags: , ,

Maps of noise

Karim Douïeb, in collaboration with Possible, mapped noise in Paris, New York, and London. The color on each map represents noise level, and if you have your sound on, you can mouse over areas to hear what noise might be like. The project, Noisy Cities, is an adaptation of Douïeb’s previous map of Brussels.

You get a good idea of what noise pollution is like geographically. All it needs now is a machine to blow varying levels of smog in your face.

Also something new I learned: the Department of Transportation has a transportation noise map that shows modeled noise levels nationally.

Tags: , ,

Using noise in creative coding

Oftentimes visuals generated through code can seem cold and mechanical when you’re after something more warm that breathes life. Introducing organized noise into the mix is one path. Varun Vachhar describes how you might use noise in the context creative coding.

Tags: ,

Generate a noise field from an image

Kjetil Golid made an interactive that lets you generate a noise field using a gradient from an image of your choosing. Fun. And excellent wallpaper material.

Tags: ,

Drawing with noise

This looks like a fun Processing tutorial by Etienne Jacob. Use noise to draw organic-ish loopy GIFs. I bet the logic could be ported to R.

Tags: , ,

Common statistical interpretation mistakes

Statistics is a game of subtleties, and you lose when you don’t pay attention to the details. Here are a handful of common mistakes when interpreting the numbers. In a nutshell: You get into trouble when you assume and ignore.

Tags: , , ,