Category Archives: data analysis
Preliminary Proposal Survey: Respond by May 1, 2013
Dear Readers,
As alluded to in previous posts, we are continuing to collect a variety of data and reactions to the preliminary proposal system. We have now received approval to directly solicit your views via a survey. Program Directors in the Division of Environmental Biology at the National Science Foundation (NSF) are asking Principal Investigators (PIs) (current, past, or future) to take this survey (http://www.surveymonkey.com/s/DEB_IOS_program_feedback) to provide feedback on our new proposal review process.
Please spread the word about this survey. We will be sending emails to PIs asking that they participate in the survey, but we need our readers to share this information as well. We need your help to reach those whose current email addresses may not be in our records and to encourage everyone who receives the invite to click the link and complete the survey. We are requesting potential respondents to complete the survey by Wednesday, May 1, 2013.
This survey is an important mechanism that NSF is using to obtain quantitative feedback about the new review process. Our target audience is investigators who have had funding from DEB or IOS or who are likely to submit a proposal to DEB and/or IOS in the next 1-2 years. We will use the results of the survey, which is anonymous, to assess the level of satisfaction with various aspects of the new review process. All answers are confidential, and will have no bearing on your future interactions with the NSF. The survey should require 10-20 minutes to complete.
Thank you for taking the time to respond to the survey and encouraging your colleagues to do so too.


Posted by in data analysis, preliminary proposals, Program Announcements
DEB Numbers: Preproposals and Collaboration, Part 2
This DEB Numbers post is a continuation of our previous post, here, where we laid out some of the measures of collaboration that are available to us in DEB. If you are new to DEB Numbers posts, we suggest you read our introductory message to familiarize yourself with some of the conventions we use here to describe what can be confusing information.
How many collaborators?
Beyond the presence/absence of GPG-defined collaborative proposals or presence/absence of Co-PIs on a project, we have some additional information that may shine a light on other facets of the collaboration question.
Clearly, an immediate follow-up question to presence/absence of collaboration is “how many are involved?” In answer to this we can take a look at the average number of names on a project’s cover sheet(s) or the average number of institutions on a project’s budget(s). The following tables exclude preliminary proposals because those projects are submitted by single institutions without budget information and so do not reliably provide complete information for persons or institutions. (The Excel template required for January, 2013 preliminary proposals was an attempt to improve capture of such info.)
Mean PI/Co-PI Names on Full Proposal Project Cover Sheet(s) for DEB Core Program Panel Submissions and Awards FY2007-FY2013

Mean Institutions in Full Proposal Project Budget(s) for DEB Core Program Panel Submissions and Awards FY2007-FY2013

*Tentative numbers for FY2013 under the Continuing Resolution budget scenario.
For both mean persons and mean institutions per project submission, we do not see any large change in FY2013 which would signify some sort of catastrophic impact on collaboration habits in project submissions.
The numbers for both mean persons and mean institutions on the awards, however, may give one pause. Especially if plotted, the visualization can seem frightening:

For all four measures of the awards, FY2013 is down from FY2012. In three of the four cases the FY2013 drop is the largest single year change in the set. Since we saw in the previous post on collaborations that the proportions of single investigator versus collaborative project awards had not changed, this observed change requires that the size of groups involved in collaborative projects expected to be awarded for FY2013 are somewhat smaller than in previous years. How much smaller? Well, the mean changes by ~.25 in the largest drop so we are looking at one fewer participant for every four multi-investigator project awards. This is definitely something we are keeping an eye on but, given the unique circumstances in FY2013, our interpretation is it does not yet signal a problem with the review system but rather a trade-off with the budget.
Such a decrease actually makes sense in the context of a limited and uncertain budget. Especially given the focus on funding rates and maximizing the number of projects awarded, programs have an incentive to spread the available funding over as many projects as possible. Programs also seek balance between multi-investigator and single investigator project awards. If multi-investigator projects with smaller collaborative groups cost less than similar projects supporting larger groups of PIs and Co-PIs, the funds saved on the less costly projects could enable more awards to be made in total.
Inter-generational Collaboration
The last measure we will take a look at in this discussion highlights a specific aspect of the collaboration concern that was raised in some quarters, namely that the submission limit would stifle collaboration between younger and older researchers. The best measure we have to look at such inter-generational collaboration is the terminal degree year of the researchers. This number is part of each individual’s FastLane profile. We can capture that data for the participants in each multi-investigator project and calculate the number of years between the most recent and most remote terminal degree years on each project. The distribution of these degree year ranges was compiled for DEB Core Program Panel Multi-Investigator Projects awarded from FY2007 through FY2013. These distributions are presented below, without further commentary, as a series of box-and-whisker plots.

We hope these two posts have started you thinking about collaboration and look forward to continuing the discussion in the comments and future posts.


Posted by in collaboration, data analysis, DEB Numbers, preliminary proposals
DEB Numbers: Preproposals and Collaboration, Part 1
A topic we have been interested in since long before the launch of the two-stage review process is how collaboration plays into the review process in DEB. In this post, we explore the various definitions of collaborative proposals and look at measures of the extent of collaboration in DEB project submissions and awards. If this is your first DEB Numbers post, I suggest you read our introductory message to familiarize yourself with some of the conventions we use here to describe what can be confusing information.
What does collaboration mean in DEB?
We mentioned in a previous post that the NSF GPG recognizes two different arrangements as “collaborative proposals“: 1) single proposal jackets with additional institutions as subawards, and 2) linked proposal jackets submitted by multiple institutions. Only the second arrangement is explicitly labeled as “Collaborative Research:…” in the project title. The common feature of these two arrangements is that the full proposal projects contain budgetary information submitted by two or more organizations.
In conversation, DEBers often use the shorthand term “collabs.” This use usually refers to only those projects consisting of multiple linked proposal jackets with “Collaborative Research:…” titles. We are particularly interested in this subset of collaborative proposals internally because they pass through review as a single unit but become individual grants if awarded and that has effects on the processing workflows.
DEB Numbers posts report collaborative proposal information incorporating both arrangements described in the GPG.
We also recognize that there is more to collaboration than organizations coordinating project budgets. Counts of GPG defined “collaborative proposals” do not account for the vast majority of cooperative arrangements that fall under a reasonable general-public understanding of collaboration. For instance, Co-PIs from the same university in the same or complementary fields are clearly taking part in collaboration but only a single institution receives an award. A foreign counterpart providing access to a collection or dataset may be thought of as a collaborator (and may even have provided what solicitations call a “letter of collaboration” confirming their willingness to provide support to a project) but is not a PI or Co-PI and their organization is not an awardee. Neither of those constitutes a “collaborative proposal” but they are aspects of collaboration that interest us. However, data on such collaborations are not always systematically captured during the submission process or award life-cycle.
Our abilities to scrape meaningful data on these deeper facets of collaboration from NSF records vary, often from difficult to currently unavailable. But, there is a lot of promise in the future. The development of altmetrics in the wider community, StarMetrics within federal agencies, and the continued upgrading and replacement of old systems with new ones designed with data needs in mind suggest that in a couple of years we will have operational tools to better explore project collaboration.
One immediate development in this direction is the migration of project reporting from FastLane to Research.gov. Current grantees should have heard about this by now. The switch will make the information in awardee reports easier to draw out and analyze. However, it will also be a fresh start. We do not expect to have backward conversion of old records. At the program level, we do not know what all the outputs and data products from the new form will look like (either internal or external to NSF). It will definitely require time and exploration to get enough data into the reporting system to figure out how to recombine it with existing data sources and produce new insights.
Those limitations in mind, there are several pieces we can look at today to give a picture of the landscape of collaboration over the last several years.
For starters we can look at the numbers of individuals appearing on project cover pages. We can also look at the numbers of institutions represented in project budgets. With these numbers we can look for trends in the representation of various collaborative arrangements in the submission and award portfolios.
Proportions of Three Collaboration Strategies in the Portfolio of Project Submissions to DEB Core Program Panels FY2007-FY2013

^Institutional involvement beyond the lead organization on a proposal jacket is captured in budgetary information. This data is not generated in the submission of preliminary proposals.
*Tentative numbers for FY2013 under the Continuing Resolution budget scenario.
Here we have the data for three types of collaboration strategies: Collaborative Proposals (GPG-definition requiring 2 or more institutions involved in the project budget), Multi-investigator projects (a broader concept of collaboration including all projects with Co-PIs even if from a single institution), and Single Investigator Projects (no named collaborations with other institutions or Co-PIs). There is not much to interpret, the relative contributions of each collaboration strategy to the submitted project portfolio has been amazingly constant even through the FY2010 post-stimulus submission spike and preliminary proposal debut. The only notable feature is the apparent relative increase in formal collaborative proposals at the FY2013 full proposal stage. That change would appear to run counter to some of the concerns voiced at the launch of the two-stage review process. However, that number is also a decent, if imperfect, proxy for the proportion of collaborative proposals in invited preliminary proposals. When viewed in that context, it is less exciting.
Proportions of Three Collaboration Strategies in the Portfolio of Awards or Invitations from DEB Core Program Panels FY2007-FY2013
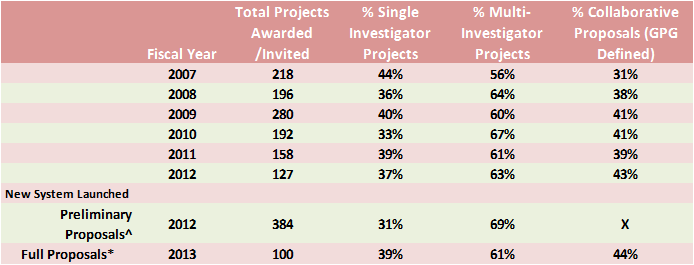
*Tentative numbers for FY2013 under the Continuing Resolution budget scenario.
Here we see a bit more variation over the reviewed period, but we are also considering a much smaller population. Again, however, the numbers coming out of FY2013 are not out-of-place when compared against the range of values encountered since FY2007. If the X in this table were replaced with the 43% collaborative proposals from the FY2013 full proposal submission portfolio, it too would fit right in. Regarding the preliminary proposals in FY2012, Multi-Investigator Projects appear to have fared a little better than normal at the point of invitation but we have only a single data point and that difference must be interpreted in light of several factors: single investigator CAREER projects were not part of that review stage, and both panelists and Program Officers were aware of publiczied concerns about negative impacts on collaboration and could have responded with behavioral changes.
These data initially suggest that the two-stage review process is not having an effect on collaborative proposal submissions or outcomes. “But,” you may say, “this data only reflects presence/absence of a technical marker of collaboration, what about measures of ‘how much’ collaboration is happening?” Currently such information pushes the limits of our ability to glean data from the records, but we will take a look at what we can in part two.


Posted by in collaboration, data analysis, DEB Numbers, preliminary proposals
DEB Numbers: Preproposals and Collaboration, Part 1
A topic we have been interested in since long before the launch of the two-stage review process is how collaboration plays into the review process in DEB. In this post, we explore the various definitions of collaborative proposals and look at measures of the extent of collaboration in DEB project submissions and awards. If this is your first DEB Numbers post, we suggest you read our introductory message to familiarize yourself with some of the conventions we use here to describe what can be confusing information.
What does collaboration mean in DEB?
We mentioned in a previous post that the NSF GPG recognizes two different arrangements as “collaborative proposals“: 1) single proposal jackets with additional institutions as subawards, and 2) linked proposal jackets submitted by multiple institutions. Only the second arrangement is explicitly labeled as “Collaborative Research:…” in the project title. The common feature of these two arrangements is that the full proposal projects contain budgetary information submitted by two or more organizations.
In conversation, DEBers often use the shorthand term “collabs.” This use usually refers to only those projects consisting of multiple linked proposal jackets with “Collaborative Research:…” titles. We are particularly interested in this subset of collaborative proposals internally because they pass through review as a single unit but become individual grants if awarded and that has effects on the processing workflows.
DEB Numbers posts report collaborative proposal information incorporating both arrangements described in the GPG.
We also recognize that there is more to collaboration than organizations coordinating project budgets. Counts of GPG defined “collaborative proposals” do not account for the vast majority of cooperative arrangements that fall under a reasonable general-public understanding of collaboration. For instance, Co-PIs from the same university in the same or complementary fields are clearly taking part in collaboration but only a single institution receives an award. A foreign counterpart providing access to a collection or dataset may be thought of as a collaborator (and may even have provided what solicitations call a “letter of collaboration” confirming their willingness to provide support to a project) but is not a PI or Co-PI and their organization is not an awardee. Neither of those constitutes a “collaborative proposal” but they are aspects of collaboration that interest us. However, data on such collaborations are not always systematically captured during the submission process or award life-cycle.
Our abilities to scrape meaningful data on these deeper facets of collaboration from NSF records vary, often from difficult to currently unavailable. But, there is a lot of promise in the future. The development of altmetrics in the wider community, StarMetrics within federal agencies, and the continued upgrading and replacement of old systems with new ones designed with data needs in mind suggest that in a couple of years we will have operational tools to better explore project collaboration.
One immediate development in this direction is the migration of project reporting from FastLane to Research.gov. Current grantees should have heard about this by now. The switch will make the information in awardee reports easier to draw out and analyze. However, it will also be a fresh start. We do not expect to have backward conversion of old records. At the program level, we do not know what all the outputs and data products from the new form will look like (either internal or external to NSF). It will definitely require time and exploration to get enough data into the reporting system to figure out how to recombine it with existing data sources and produce new insights.
Those limitations in mind, there are several pieces we can look at today to give a picture of the landscape of collaboration over the last several years.
For starters we can look at the numbers of individuals appearing on project cover pages. We can also look at the numbers of institutions represented in project budgets. With these numbers we can look for trends in the representation of various collaborative arrangements in the submission and award portfolios.
Proportions of Three Collaboration Strategies in the Portfolio of Project Submissions to DEB Core Program Panels FY2007-FY2013
^Institutional involvement beyond the lead organization on a proposal jacket is captured in budgetary information. This data is not generated in the submission of preliminary proposals.
*Tentative numbers for FY2013 under the Continuing Resolution budget scenario.
Here we have the data for three types of collaboration strategies: Collaborative Proposals (GPG-definition requiring 2 or more institutions involved in the project budget), Multi-investigator projects (a broader concept of collaboration including all projects with Co-PIs even if from a single institution), and Single Investigator Projects (no named collaborations with other institutions or Co-PIs). There is not much to interpret, the relative contributions of each collaboration strategy to the submitted project portfolio has been amazingly constant even through the FY2010 post-stimulus submission spike and preliminary proposal debut. The only notable feature is the apparent relative increase in formal collaborative proposals at the FY2013 full proposal stage. That change would appear to run counter to some of the concerns voiced at the launch of the two-stage review process. However, that number is also a decent, if imperfect, proxy for the proportion of collaborative proposals in invited preliminary proposals. When viewed in that context, it is less exciting.
Proportions of Three Collaboration Strategies in the Portfolio of Awards or Invitations from DEB Core Program Panels FY2007-FY2013
*Tentative numbers for FY2013 under the Continuing Resolution budget scenario.
Here we see a bit more variation over the reviewed period, but we are also considering a much smaller population. Again, however, the numbers coming out of FY2013 are not out-of-place when compared against the range of values encountered since FY2007. If the X in this table were replaced with the 43% collaborative proposals from the FY2013 full proposal submission portfolio, it too would fit right in. Regarding the preliminary proposals in FY2012, Multi-Investigator Projects appear to have fared a little better than normal at the point of invitation but we have only a single data point and that difference must be interpreted in light of several factors: single investigator CAREER projects were not part of that review stage, and both panelists and Program Officers were aware of publicized concerns about negative impacts on collaboration and could have responded with behavioral changes.
These data initially suggest that the two-stage review process is not having an effect on collaborative proposal submissions or outcomes. “But,” you may say, “this data only reflects presence/absence of a technical marker of collaboration, what about measures of ‘how much’ collaboration is happening?” Currently such information pushes the limits of our ability to glean data from the records, but we will take a look at what we can in part two.
Posted by in collaboration, data analysis, DEB Numbers, preliminary proposals
DEB Numbers: Revisiting performance of PI demographic groups, Part 2
This post is a continuation of a discussion of the early data on the performance of Beginning Investigators and Primarily Undergraduate Institutions. Please read Part 1 before continuing for background and explanation of the terms used. If you are new to DEB Numbers posts, I suggest you read our introductory message to familiarize yourself with some of the conventions we use here to describe what can be confusing information.
When looking at the performance of a particular group of interest through the review process, success rate numbers are complicated by the trend of increasing proposal submissions that is impacting pretty much everyone across all of NSF. Falling success rates tend to distract from comparisons of the relative performance of a particular group of submitters. In the case of the two-stage review process in DEB, we heard particular concerns about the performance of Beginning Investigators and Primarily Undergraduate Institutions through the preliminary and full proposal stages. In order to evaluate how those groups are performing, we are looking at the representation of each of those groups in the portfolio of projects submitted and portfolio of awards made.
Representation of Projects Identifying the Lead PI as a Beginning Investigator (BI) and Projects Identifying the Lead Institution as a Primarily Undergraduate Institution (PUI) in the Portfolio of Project Submissions in DEB Core Program Panels FY2007-FY2013

In the first year of preliminary proposal review, both BIs and PUIs contributed to the preliminary proposal project pool at rates consistent with their submissions under the old system. At this date, it does not appear that the two-stage review mechanism either encouraged or discouraged submission from these groups to a greater degree than the general PI population. However, the submissions of both groups at the FY2013 full proposal stage constituted a smaller share of the projects. When we look at the portfolio of awards and invitations…
Representation of Projects Identifying the Lead PI as a Beginning Investigator (BI) and Projects Identifying the Lead Institution as a Primarily Undergraduate Institution (PUI) in the Portfolio of Awards or Invitations from DEB Core Program Panels FY2007-FY2013

*Note: Tentative numbers for current fiscal year under the Continuing Resolution budget plan: 80% of the 2012 budget. The FY2013 Full Proposal counts include full proposal projects submitted via CAREER, OPUS, RCN and co-reviews.
…we can see that both groups’ contribution to the portfolio of invitations coming out of the FY2012 Preliminary Proposal stage was on the low end, but within, the range seen for award portfolios since FY2007. The tentative numbers for the FY2013 Full Proposal stage put BIs firmly within the historic range for representation in the award portfolio. PUIs are on the very low end, but still within the range since 2007. Since we are still operating under a Continuing Resolution and the planned award portfolio may still change significantly, it is too early to conclusively say if the process impacted either of these groups.
One final interesting note that comes out of the current data is that while BIs represented 21.4% of the invited preliminary proposal projects, they only constituted 18.1% of the full proposal projects submitted. On the other hand, PUIs were only 12.0% of the invited preliminary proposal projects, but were 14.6% of the submitted full proposal projects. This difference means that the full proposal projects received outside of the preliminary proposal stage via CAREER, OPUS, RCN and co-review had a few more PUIs and a few less BIs relative to the regular proposal submission population.
The ultimate portfolio of awards is determined by the recommendations of the DEB Program Officers, within the constraints of the program budget, and reflecting the advice of the review panels. Here we have taken a look at the recent history and tentative FY2013 numbers for expected awards. At this point in time, the whole process appears to be avoiding disproportionate impacts on Beginning Investigators and Primarily Undergraduate Institutions. However, both of these groups have historically been minority groups in submissions to DEB and furthermore underrepresented in award portfolios compared to submissions. While we can report changes over time and compare between groups, these numbers do not provide answers to the questions that underpin evaluations of progress: What is the right mix of Beginning Investigators and Primarily Undergraduate Institutions in an award portfolio? And, how can we reach the right mix in awards? Would such a mix require a change in submission patterns and/or changes in peer review practices and/or changes in Program Officer handling of the submissions we already receive?


DEB Numbers: Revisiting performance of PI demographic groups, Part 1
Just before the end of December 2012, the Division of Environmental Biology sent out an email message to a list of all people listed as PIs and Co-PIs on DEB proposals since the start of fiscal year 2008. (Aside: if you did not get the email and think you should have, make sure your FastLane profile information is up to date.) This message included a notice of our plans to start blogging among other efforts to enhance interactions between DEB and the research communities. About 1/3 of the message consisted of several snippets of Division-wide data from the two-stage proposal process with specific tables focused on two groups: Early Career Investigators and Primarily Undergraduate Institutions (PUIs). We received helpful feedback from several readers of the original email pointing out ways in which the presentation could have been clearer. We thank you for that. It is already helping to make this blog better.
Since many out there may not have seen the original message, and others may have been intrigued to learn more, this post re-visits and expands on those numbers.
The data snippets in the email were meant to begin a discussion, they were not intended to be comprehensive or the final word. There are other ways to look at the numbers and significant context and nuance simply could not be crammed in to a reasonable email. Actual performance numbers from the two-stage review process are just starting to come in and even those will change somewhat as Program Officers pursue every opportunity to secure funding through the fiscal year’s end.
In the spirit of the prior Numbers post, before we come back to the data we require a detour to explain some terminology (in bold):
Our numbers are reported by fiscal year (which runs Oct. 1 to Sept. 30). The first round of new solicitation full proposals, the full proposals reviewed in October of calendar year 2012, are 2013 proposals according to the fiscal calendar.
The term proposal can be used in several ways, and it is not always clear what is meant when it is used as a stand-alone data label (e.g., “the program reviewed 1200 proposals”). This perennial confusion stems from a technical distinction – the individual document packages we review and process are properly called “proposal jackets”. A single submitting organization prepares and submits an individual proposal jacket. While many proposal jackets involve only a single organization, sub-awards enable two or more organizations to be included in a single proposal jacket. Alternatively two or more organizations can submit separate proposal jackets which are bundled together as a single package through the review process with one organization identified as the lead organization. The NSF GPG defines both single proposal jackets with sub-awards and bundled proposal jackets as “collaborative proposals”[1]. Thus, when numbers are presented for “proposals”, it is not clear if the bundled proposal jackets are being counted once per package or each proposal jacket is being counted separately[2].
Our convention in DEB is to avoid using “proposal” alone as a formal data label. We use projects to refer to whole packages that go through review (whether single institution or collaborative bundle) and count each bundle of proposal jackets once. In cases where numbers are being reported by individual proposal jacket, we will identify the data as based on proposal jackets.
Finally, and hopefully enough to start looking at the numbers from reasonably common ground, we need to address what is meant by the % calculations variously called success (invite or funding) rate in DEB.
For a group of projects under review, we can categorize them into one or more submission sub-groups. Each project is ultimately assigned to an outcome of acceptance (invited, or awarded) or rejection (not invited, declined). So, we can take a look at the review outcomes like this:
| # Accepted | # Rejected | Total Reviewed | |
| # Projects Sub-Group A | Xa | Ya | (Xa + Ya) |
| # Projects Sub-Group B | Xb | Yb | (Xb + Yb) |
| # Projects Sub-Group C | Xc | Yc | (Xc + Yc) |
| # Projects Total | X | Y | (X+Y) |
Note: Sub-Groups may not be mutually exclusive so (Xa +Xb + Xc) can be > X.
When DEB presents success rates, those are the percent calculations across rows, such as:
Proportion of Sub-Group A that was accepted = Xa/(Xa+Ya)*100% (e.g., 17% of PUI full proposal projects were funded, 32% of all preliminary proposals were invited [both fictional examples])
Success rates formulated this way are what have historically been presented as one of the, if not the sole, metric for NSF program health. But, this number says more about needs for resources and program management on the NSF side than it does about the performance of submitters. We can easily see from tracking success rates over time that demand for funding is growing and outstripping budget growth widely across NSF programs and categories of submitters. However success rate is a blunt and superficial measure when it comes to comparing performance between sub-groups.
If you want to compare performance of sub-groups over time, between programs, etc. it is much more revealing to look at the contribution of those sub-groups to the portfolio of projects for a given review stage or outcome. In the above table, we can calculate Portfolio Representation using the numbers down the columns, such as:
Proportion of Total Reviewed projects from Sub-Group C = (Xc+Yc)/(X+Y)*100% (e.g., 15% of funded full proposal projects were from PUIs, 21% of all reviewed preliminary proposals were from early career investigators [both fictional examples])
With Portfolio Representation numbers, one can quickly and easily see the extent to which the awards coming out of a program reflect the diversity of submissions coming in and how that has changed over time without the numbers being drowned out by overall growth in demand.
On to the data…
These three tables display the Success Rates for projects in DEB’s core program panels since FY2007 and include tentative data for the FY2013 full proposal stage: the October, 2012 review panels and subsequent award making. These present the same information that was included in the original email message; formatting has been updated for clarity based on feedback and reported values have been updated to ensure consistent back-casting of historical numbers and present more recent tentative numbers and estimates.
Project Submissions and Success Rate for DEB Core Program Panels FY2007-FY2013

Project Submissions and Success Rate of Projects Identifying the Lead PI as a Beginning Investigator^ for DEB Core Program Panels FY2007-FY2013

Project Submissions and Success Rate of Projects of Projects Identifying the Lead Institution as a Primarily Undergraduate Institution for DEB Core Funding Programs FY2007-FY2013

*Note: Tentative numbers for current fiscal year under the Continuing Resolution budget plan: 80% of the 2012 budget. The FY2013 Full Proposal counts include full proposal projects received as CAREER, OPUS, RCN and co-reviews.
^Note: As indicated on the BIO-specific Proposal Classification Form completed in FastLane and associated with the lead proposal jacket of each project.
What these numbers show is pretty much the same point we illustrated in our August, 2011 webinar to introduce the two-stage proposal review mechanism and in subsequent talks at professional meetings.
Success Rates of Projects for DEB Core Programs as shown at ESA 2012.

Success Rates have been declining overall and the trend extends back to at least the early 2000s when success rates were above 20%. Decreasing success rates are due largely to increases in submissions. The dynamics behind increasing submissions are complex and reach beyond the scope of this particular post. However, the end product of those dynamics was a pattern of unsustainable growth driving a falling success rate with ever more submissions.
The collective effort required to create, submit and review projects gradually grew ever more out-of-whack relative to the payback seen in support for research and feedback to PIs. We heard this from the community over many years in panels, at professional meetings, and in the phone and email exchanges with the vast majority of PIs being declined funding. This state of affairs was not unique to DEB or even BIO; in 2007 NSF published the results of a survey of PIs and reviewers which reported this same basic message across the entire agency. As in the graphic above, trends continued to worsen to the present.
The decision to develop and launch a two-stage review cycle was made in this context, following models employed elsewhere in the agency.
In implementing a preliminary proposal stage, DEB recognized that success rates would likely not be improved over the entire process. Especially in the first year, we expected a sizable increase in submissions because news of a change would inspire new or previously dissuaded PIs to enter the process. Additionally, preliminary proposals, being perceived as a less burdensome entry to the system, should incentivize participants to submit even more projects. In practice, we did see a significant increase in projects submitted:
1626 preliminary proposal projects
+ 163 full proposal projects via CAREER, OPUS, RCN, and co-review
= 1,789 unique projects reviewed in the core programs during the first full review cycle.
This total project load is roughly 35% larger than during the last full fiscal year of the old system: 1329 projects in FY2011 (and 25% larger than the previous high water mark in 2010). Given flat program budgets, and assuming the same average award size, we would therefore expect the overall funding rate to be between 8 and 9% over the entire two-stage cycle. However, we are currently under a continuing resolution with a budget of 80% of what we had in FY2012 to both start new awards and cover continuing grant increments on awards made in prior years. The tentative numbers at this point in time show a success rate of about 6% over the two-stages.
The major difference in the two-stage review system is that the PI and reviewers are not required to do all of the work up-front for this huge number of projects just to see 10% of them funded. Instead, during the preliminary proposal stage, the success rate can be higher than under the old system while the costs to the PI for producing (especially in regards to administrative portions of a submission) and to the community for reviewing a preliminary proposal are reduced relative to a full proposal[3]. Then, in the full proposal stage, a significantly reduced number of projects are submitted allowing the work of preparing and reviewing the full-length submissions to be balanced against a better success rate.
The tables above bear that out within the limitations of only a single full cycle of the new system. Even when looking at Beginning Investigators or PUIs, the success rates at either stage of the review process were generally higher than the success rates seen for prior years. Additionally the differences in the success rates for these groups compared to the success rate for all projects do not appear to show exacerbation of those differences under the new system. We can see the relative performance of these groups better by looking at contributions of Beginning Investigators and PUIs to the portfolio of submission, invitees, and awards which we explore in Part 2.
[1] Further exploration of “collaborative proposals”, differences between the GPG and colloquial use, and how we are counting them will be a future post.
[2] Another potential post to look forward to: how differences in counting choices provide different pictures of DEB growth
[3] Note: This refers to effort per proposal. Individual panelists likely experience little change in total work load since in most cases they will see a greater number of shorter proposals. While not a quantitative improvement for preliminary proposal panelists, we received many comments indicating improved quality of their experience.


DEB Numbers: An Introduction
This is the first of what will hopefully be somewhat regular posts on Division of Environmental Biology data. Our goals for these posts include: stimulating discussions with our PI community, providing deeper context for understanding the grant review process, and sharing insights we gain through ongoing examination of our programs.
This introductory post outlines some of the things we hope to cover in future posts and provides an overview of the challenges that apply to reporting and interpreting DEB Numbers.
Who will be writing these posts?
In DEB we have several analysts whose duties include assisting in management of the review process and working with the NSF databases to produce reports and analyses as well as taking part in communications with our PI community. Expect most of the posts under the DEB Numbers heading to be written by and based on the work of the analysts. Program Officers in the Division will also contribute to Numbers posts but they have other priorities (e.g., managing review of your individual proposals) and expect to author these posts less frequently.
What types of data will be presented?
What we will provide to you are our best efforts to clearly and accurately present the numbers you care about for DEB programs. This includes information on things like submission trends, program demographics, and various portfolio metrics. The scope of the presented data will be limited to the programs housed in the Division of Environmental Biology, though comparisons may be made to public data presented elsewhere. Hopefully, your questions, feedback, and comments will help us to advance our data presentations beyond the static glimpses offered in outreach talks.
We will not, as stated in this blog’s policy notes, discuss or provide data about individual proposals or groups of proposals at a level that the information could be tied to specific applicants.
Timeliness, completeness, and terminology: challenges to presenting data clearly and definitively
Timeliness: The U.S. federal government operates on a fiscal year calendar which runs from October 1 – September 30. NSF reporting and analyses account for each proposal by the fiscal year when a decision was recorded. For instance, full proposals received for the August 2012 deadline ultimately become part of the FY2013 dataset because they are reviewed and processed to completion after October 1, 2012. However, because we process reviews and decisions throughout the fiscal year, proposal data is coming in right up until the end of business on September 30. This creates a conflict between our desires to present information quickly and our responsibility to be accurate.
Completeness: We can only show you the data that we have. Some things we recognize as important and know you care about cannot be definitively reported because of gaps in the data. For instance, many pieces of key demographic information for reporting on historically underrepresented groups by gender, ethnicity, or career status can be based only on the records the public voluntarily self-reports through approved information collections (the optional PI Information fields of your FastLane profiles). Other potentially useful data is incomplete because the data fields were recent additions or are specific to certain programs and so are missing from portions of the record.
Terminology: We recognize that the phrasing and terminology we use may be interpreted to different ends by blog participants. There are many key words and phrases that have a common English use, one or more colloquial uses in the PI community, and a specific technical meaning inside NSF. Just a few that spring to mind are: proposal, project, jacket, collaborator, year, broader impact, postdoc, ethnicity, underrepresented, minority, program, peer review, and merit review.
Our aim is to explain and consistently apply technical wording (e.g., specifying “fiscal year”). However, this is no small feat with NSF where we have hundreds of solicitations, submission mechanisms and specialized considerations that vary from office to office and year to year. We will inevitably miss some terms but welcome the opportunities provided by a blog to quickly see when we have been confusing and clarify.
Responses to these challenges
1) Values for the current fiscal year are tentative. They will be noted, as applicable, with qualifiers such as “estimated (est.)”, “tentative” or “to date (t.d.)”. Generally, final values will not be available until after the start of the following fiscal year or later.
2) Descriptive language will be attached to values where the data has known gaps or limitations (e.g., the success rate for proposals self-reporting a female PI was XX%, at least YY proposals were received from minority PIs).
3) Technical terms will be explained when presented and the explanation referenced when the term is used in future posts.
4) If you are not seeing what you are looking for or something seems off, speak up in the comments.
Coming up next in DEB Numbers: Revisiting performance of PI demographic groups during the first preliminary proposal cycle.


Posted by in data analysis, DEB Numbers, introduction