Fiscal year 2016 officially closed out on September 30. Now that we are past our panels in October and early November, we have a chance to look back and report on the DEB Core Program merit review and funding outcomes for FY 2016.
This post follows the format we’ve used in previous years. For a refresher, and lengthier discussions of the hows and whys of the metrics, you can visit the 2015, 2014, and 2013 numbers.
Read on to see how 2016 compares.
FY2016 Summary Numbers
The charts below all reflect proportions of DEB Core Program projects through each stage of the review process: preliminary proposals, full proposals, and awards.
In the review process leading to awards in FY2016:
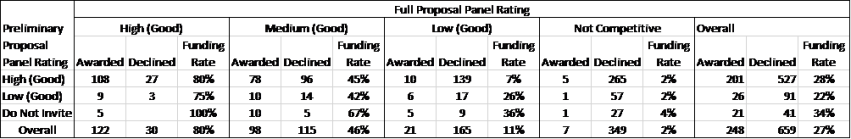
DEB reviewed 1502 preliminary proposals received under the DEB Core Programs solicitation and LTREB solicitation in January 2015, about 26% of which were invited to the full proposal stage.
The preliminary proposal invitees were joined at the full proposal stage by 1) Direct submissions to DEB under the CAREER, OPUS, and RCN solicitations, and 2) Projects shared for co-review by another NSF program. Altogether 524 full proposals were reviewed in DEB during October and November of 2015.
From this pool of full proposals, DEB made awards to 133 projects (technically, these were 202 separate institutional awards but for analysis purposes we count collaborative groups once, i.e., as a single proposed project).
Below, we present and discuss the Division-wide success rate and some selected project demographics that were concerns coming in to the preliminary proposal system. The demographic numbers are presented as proportions for comparison across the review stages. However, the progressive reduction in size of the denominators from preliminary proposals (1502) to awards (133) means each step becomes more sensitive to small absolute changes.
Success Rate
Success rate is a function of the number and size of requests submitted by the research communities and appropriated funding levels. The success rate for research proposals in the DEB Core Programs (Figure 1) has stabilized (even rebounded somewhat) since the preliminary proposal process was instituted. This stabilization emerges from:
- Stable award numbers: Since FY 2013 the number of Core Program awards has consistently been between 131 and 136 funded projects[i].
- Reduced request numbers: The initial wave of new people “testing the waters” by submitting a preliminary proposal is subsiding. As PIs became more familiar with the process, total submissions have dropped by about 10% across the last three years. With stable award numbers, fewer submissions translate directly into a 10% increase in overall success rate from 7.3% in FY2013 to 8.1% for 2016.

Figure 1: DEB Core Program success rates from fiscal year 2007 through the present. Prior to fiscal year 2012, there were two rounds of full proposal competition per fiscal year. Preliminary proposals were first submitted in January 2012, initiating the 2-stage review process and leading to the fiscal year 2013 award cohort.
Calculation Notes:
Preliminary proposal success rate is calculated as the number of invitations made divided by the number of preliminary proposals submitted.
Full proposal success rate is calculated as the number of awards made, divided by the number of full proposals reviewed.
Note that post-2012, under the preliminary proposal system, the set of full proposals reviewed is ~80% invited full proposals and ~20% CAREER, OPUS, RCN and co-reviewed proposals, the latter of which are exempt from the preliminary proposal stage.
Overall success rate is calculated as the number of awards made divided by the total number of distinct funding requests (i.e., the sum of preliminary proposals submitted plus the exempt CAREER, OPUS, RCN, and co-reviewed full proposals).
Reminder: Elevated success rates (in 2009 and 2012) were due to:
- a one-time ~50% increase in funding for FY2009 (the ARRA economic stimulus funding) without which success would have been ~13-15%; and,
- a halving of proposal submissions in FY2012 (the first preliminary proposal deadline replaced a second full proposal deadline for FY2012), without which success would have been ~8-9%.
Individual and Collaborative Projects
As seen in Figure 2 below, there was little year-to-year change in the submission and funding success of single investigator projects. While the proportion of single investigator preliminary proposals increased slightly, there was a small decrease in both the full proposal and award groups. As a reminder to readers: the gap between the proportion of single investigator projects in the preliminary proposal and full proposal stages is due to the single-investigator proposals in the CAREER and OPUS categories. The CAREER and OPUS proposals are not subject to the preliminary proposal screen and make up a relatively larger portion of the full proposals. Similarly, the absence of CAREER and OPUS proposals at the preliminary proposal stage lowers the single investigator proportion of the preliminary proposal counts relative to the historical full proposal baseline.
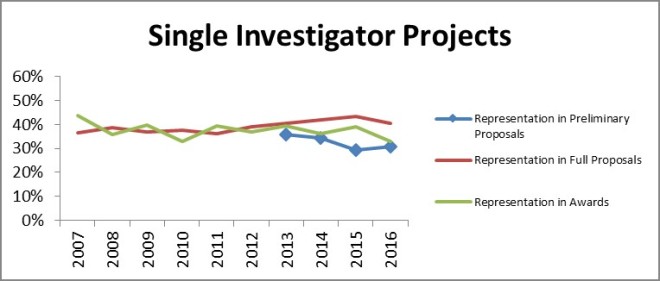
Figure 2: The proportion of DEB Core Program projects lead by a single PI over time and at the different stages of merit review.
The proportion of collaborative proposals in our award portfolio rebounded from last year’s drop and is near the all-time high for both full proposals and awards. This is consistent with the general trend toward greater collaboration over the past decade and beyond.

Figure 3: The proportion of DEB Core Program projects with two or more different institutional participants over time and at the different stages of merit review.
Readers may notice that the collaborative and single-investigator groupings don’t sum to 100%. The remainders are intra-institutional multi-PI arrangements; such projects are certainly intellectual collaborations, but they are not a “collaborative project” per the NSF PAPPG definition (Figure 3).
Early Career Scientists
The best identifier of researcher career stage is a metric we calculate. It is the difference between the year that the PI obtained their Ph.D. (a self-reported by the PI) and the current date. This number can be used as a proxy for how long each individual has been in the population of potential PIs.
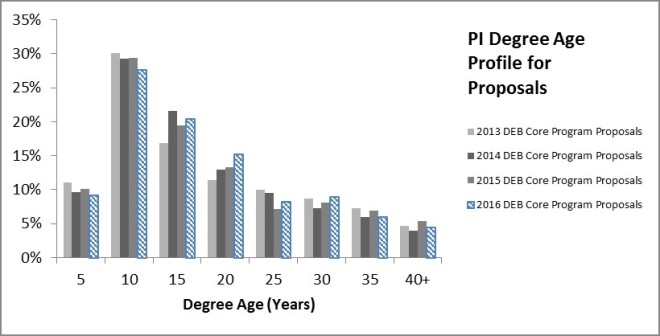
Figure 4: Distribution of degree ages among PIs on DEB Core Program full proposal submissions.

Figure 5: Full proposal success rates for PIs on DEB Core Program proposals by degree age. Figure displays annual data and a 4-year mean for the period of the preliminary proposal system in DEB.
Little changes in the profile of submitter- and awardee-degree ages from 2013 through 2016. Moreover, success rate improves slightly with degree age. Success rates climb slowly from 20% for the newest PhDs, to 30% at 35 years post PhD. Note: PIs more than 35 years post-PhD comprise ~5% or less of the total PIs on proposals and awards. Although more experienced PIs have a somewhat better individual success rate, the PI population skews toward the early career group. Thus, early-, mid-, and later-career PIs wind up with similar representation in core program award decisions.
Gender & Predominantly Undergraduate Institution (PUI) Status
Another concern heading in to the preliminary proposal system was that there would be unintended consequences for different categories of submitters. Two years ago we saw a small change in award numbers lead to a visually jarring drop in the representation of female PIs among DEB awards, as well as a jump in the proportion of PUI awardees. Last year, we saw the pattern reversed. In addition to the apparent negative correlation between the proportion of female PI awardees and PUI awardees that has appeared, the award data just appears noisier than it was under the old system. But, as we stated in last year’s 2015 Wrap-up post:
We conclude that we are witnessing a small numbers effect; 131 awards is simply not a sufficiently large “sample” to be representative of the population across all of the potential decision-making variables and concerns. PUIs are a minority component of the proposal pool (~18%). Female PIs are a minority component of the proposal pool (~30%). Beginning Investigators are a minority component of the proposal pool (~20%). Proposals that fall into two categories are an even smaller fraction of the proposal pool (~6%) and proposals that fit into all three are even smaller yet (~1%).”
Which now brings us to 2016.
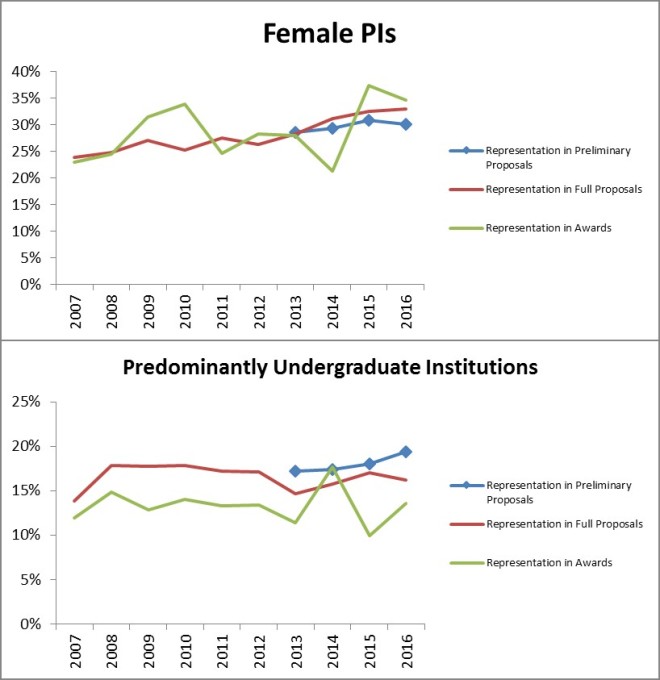
Figure 6: The representation of female PIs and predominantly undergraduate institutions in DEB Core Program proposals and awards. These two groups were noted by the community as groups of concern that would be potentially impacted by the pre-proposal system.
Once again, we see the same pattern in the representation of female PIs and PUIs in the award portfolio: one goes up, the other down. As best as we can determine, our previous conclusion still provides the best explanation: with only 133 projects awarded, it’s a small numbers problem.
The longer-term pattern for both groups is not affected by these latest numbers. The proportion of female PIs has been increasing between by 0.5-1 percentage points per year. The proportion of primarily undergraduate institutions has held steady and there’s a ~4 percentage point gap from the full proposal to the award stage. The PUI gap pre-dates the preliminary proposal system and this group was not intended to be impacted by the preliminary proposal process, so we didn’t expect change.
Moreover, we note that the proportion of PUI preliminary proposals is growing. This represents a small absolute increase but is exaggerated by the reduced total number of preliminary proposals. While there has been no corresponding change in full proposals and awards, if these preliminary proposals represent new entrants to competition then we would expect some lag in those later-stage metrics. Should this development persist, it would be interesting to see if there is any effect on the representation gap between PUIs in preliminary proposals and DEB Core Programs awards. This gap is something that would likely be worth a deeper examination in the future.
Concluding Thoughts
Since the implementation of the preliminary proposal system in January 2012, we have not seen major departures from pre-2012 trajectories across measures of our portfolio with respect to PI or institution demographics or collaborations. Four years in, we have not seen indication of Division wide changes, especially any worsening of submission and award proportions among any of these major groups of concern. Success rates appear stable across multiple years for the first time in recent memory. However, the overall climate for awards remains poor due to continued funding stagnation. If there is any bright side to that fact, funding woes at least appear to not have been amplified for any particular subgroup in recent years. But, the limited purchasing power of program budgets means our ability to support the full diversity of the research community will continue to be tested and subject to difficult trade-offs.
[i] During the 13 years before preliminary proposals, DEB Core Program award numbers fluctuated quite a bit; they regularly rose or fell by 20-30 (and as many as 80!) awards per year.