Roger Peng, a biostatistics professor at John Hopkins University, talks about the past and future of data analysis, using music as a metaphor for the path.
Tags: data analysis, Roger Peng
Adam's Blogroll: click through to the author's blog
Roger Peng, a biostatistics professor at John Hopkins University, talks about the past and future of data analysis, using music as a metaphor for the path.
Tags: data analysis, Roger Peng
Posted by in data analysis, Roger Peng, statistics
Fiscal year 2016 officially closed out on September 30. Now that we are past our panels in October and early November, we have a chance to look back and report on the DEB Core Program merit review and funding outcomes for FY 2016.
This post follows the format we’ve used in previous years. For a refresher, and lengthier discussions of the hows and whys of the metrics, you can visit the 2015, 2014, and 2013 numbers.
Read on to see how 2016 compares.
The charts below all reflect proportions of DEB Core Program projects through each stage of the review process: preliminary proposals, full proposals, and awards.
In the review process leading to awards in FY2016:
DEB reviewed 1502 preliminary proposals received under the DEB Core Programs solicitation and LTREB solicitation in January 2015, about 26% of which were invited to the full proposal stage.
The preliminary proposal invitees were joined at the full proposal stage by 1) Direct submissions to DEB under the CAREER, OPUS, and RCN solicitations, and 2) Projects shared for co-review by another NSF program. Altogether 524 full proposals were reviewed in DEB during October and November of 2015.
From this pool of full proposals, DEB made awards to 133 projects (technically, these were 202 separate institutional awards but for analysis purposes we count collaborative groups once, i.e., as a single proposed project).
Below, we present and discuss the Division-wide success rate and some selected project demographics that were concerns coming in to the preliminary proposal system. The demographic numbers are presented as proportions for comparison across the review stages. However, the progressive reduction in size of the denominators from preliminary proposals (1502) to awards (133) means each step becomes more sensitive to small absolute changes.
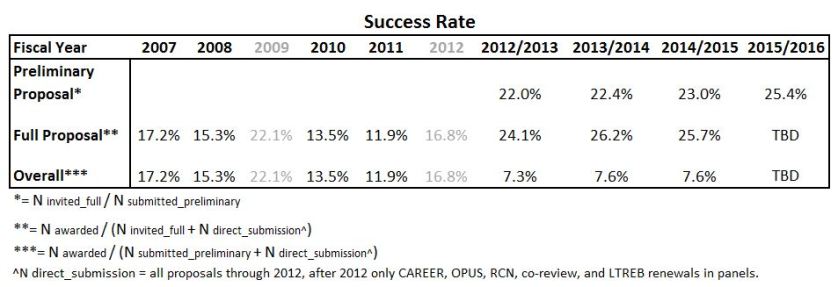
Success rate is a function of the number and size of requests submitted by the research communities and appropriated funding levels. The success rate for research proposals in the DEB Core Programs (Figure 1) has stabilized (even rebounded somewhat) since the preliminary proposal process was instituted. This stabilization emerges from:

Figure 1: DEB Core Program success rates from fiscal year 2007 through the present. Prior to fiscal year 2012, there were two rounds of full proposal competition per fiscal year. Preliminary proposals were first submitted in January 2012, initiating the 2-stage review process and leading to the fiscal year 2013 award cohort.
Preliminary proposal success rate is calculated as the number of invitations made divided by the number of preliminary proposals submitted.
Full proposal success rate is calculated as the number of awards made, divided by the number of full proposals reviewed.
Note that post-2012, under the preliminary proposal system, the set of full proposals reviewed is ~80% invited full proposals and ~20% CAREER, OPUS, RCN and co-reviewed proposals, the latter of which are exempt from the preliminary proposal stage.
Overall success rate is calculated as the number of awards made divided by the total number of distinct funding requests (i.e., the sum of preliminary proposals submitted plus the exempt CAREER, OPUS, RCN, and co-reviewed full proposals).
Reminder: Elevated success rates (in 2009 and 2012) were due to:
As seen in Figure 2 below, there was little year-to-year change in the submission and funding success of single investigator projects. While the proportion of single investigator preliminary proposals increased slightly, there was a small decrease in both the full proposal and award groups. As a reminder to readers: the gap between the proportion of single investigator projects in the preliminary proposal and full proposal stages is due to the single-investigator proposals in the CAREER and OPUS categories. The CAREER and OPUS proposals are not subject to the preliminary proposal screen and make up a relatively larger portion of the full proposals. Similarly, the absence of CAREER and OPUS proposals at the preliminary proposal stage lowers the single investigator proportion of the preliminary proposal counts relative to the historical full proposal baseline.
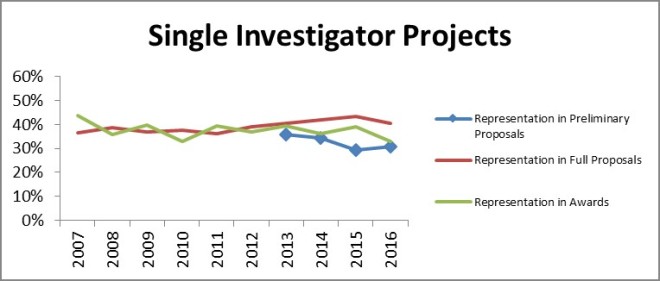
Figure 2: The proportion of DEB Core Program projects lead by a single PI over time and at the different stages of merit review.
The proportion of collaborative proposals in our award portfolio rebounded from last year’s drop and is near the all-time high for both full proposals and awards. This is consistent with the general trend toward greater collaboration over the past decade and beyond.

Figure 3: The proportion of DEB Core Program projects with two or more different institutional participants over time and at the different stages of merit review.
Readers may notice that the collaborative and single-investigator groupings don’t sum to 100%. The remainders are intra-institutional multi-PI arrangements; such projects are certainly intellectual collaborations, but they are not a “collaborative project” per the NSF PAPPG definition (Figure 3).
The best identifier of researcher career stage is a metric we calculate. It is the difference between the year that the PI obtained their Ph.D. (a self-reported by the PI) and the current date. This number can be used as a proxy for how long each individual has been in the population of potential PIs.
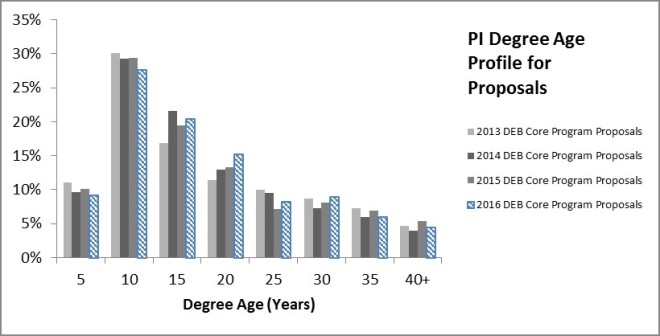
Figure 4: Distribution of degree ages among PIs on DEB Core Program full proposal submissions.

Figure 5: Full proposal success rates for PIs on DEB Core Program proposals by degree age. Figure displays annual data and a 4-year mean for the period of the preliminary proposal system in DEB.
Little changes in the profile of submitter- and awardee-degree ages from 2013 through 2016. Moreover, success rate improves slightly with degree age. Success rates climb slowly from 20% for the newest PhDs, to 30% at 35 years post PhD. Note: PIs more than 35 years post-PhD comprise ~5% or less of the total PIs on proposals and awards. Although more experienced PIs have a somewhat better individual success rate, the PI population skews toward the early career group. Thus, early-, mid-, and later-career PIs wind up with similar representation in core program award decisions.
Another concern heading in to the preliminary proposal system was that there would be unintended consequences for different categories of submitters. Two years ago we saw a small change in award numbers lead to a visually jarring drop in the representation of female PIs among DEB awards, as well as a jump in the proportion of PUI awardees. Last year, we saw the pattern reversed. In addition to the apparent negative correlation between the proportion of female PI awardees and PUI awardees that has appeared, the award data just appears noisier than it was under the old system. But, as we stated in last year’s 2015 Wrap-up post:
We conclude that we are witnessing a small numbers effect; 131 awards is simply not a sufficiently large “sample” to be representative of the population across all of the potential decision-making variables and concerns. PUIs are a minority component of the proposal pool (~18%). Female PIs are a minority component of the proposal pool (~30%). Beginning Investigators are a minority component of the proposal pool (~20%). Proposals that fall into two categories are an even smaller fraction of the proposal pool (~6%) and proposals that fit into all three are even smaller yet (~1%).”
Which now brings us to 2016.
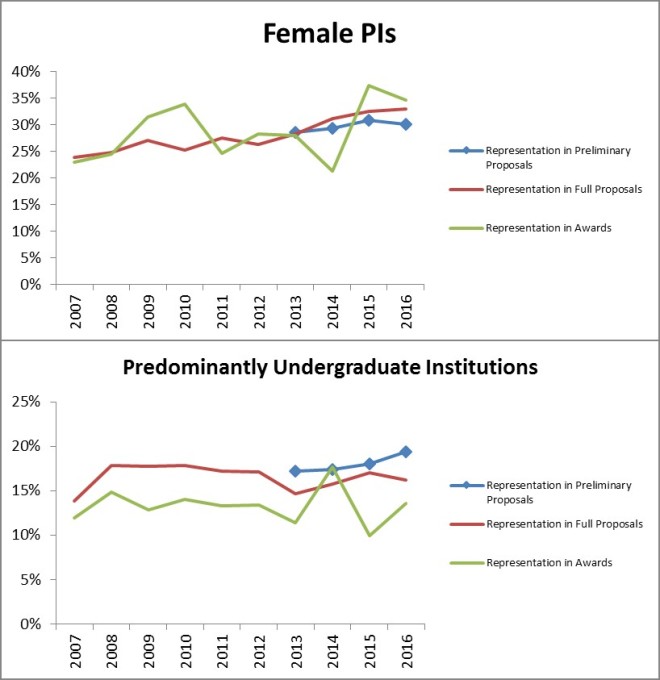
Figure 6: The representation of female PIs and predominantly undergraduate institutions in DEB Core Program proposals and awards. These two groups were noted by the community as groups of concern that would be potentially impacted by the pre-proposal system.
Once again, we see the same pattern in the representation of female PIs and PUIs in the award portfolio: one goes up, the other down. As best as we can determine, our previous conclusion still provides the best explanation: with only 133 projects awarded, it’s a small numbers problem.
The longer-term pattern for both groups is not affected by these latest numbers. The proportion of female PIs has been increasing between by 0.5-1 percentage points per year. The proportion of primarily undergraduate institutions has held steady and there’s a ~4 percentage point gap from the full proposal to the award stage. The PUI gap pre-dates the preliminary proposal system and this group was not intended to be impacted by the preliminary proposal process, so we didn’t expect change.
Moreover, we note that the proportion of PUI preliminary proposals is growing. This represents a small absolute increase but is exaggerated by the reduced total number of preliminary proposals. While there has been no corresponding change in full proposals and awards, if these preliminary proposals represent new entrants to competition then we would expect some lag in those later-stage metrics. Should this development persist, it would be interesting to see if there is any effect on the representation gap between PUIs in preliminary proposals and DEB Core Programs awards. This gap is something that would likely be worth a deeper examination in the future.
Since the implementation of the preliminary proposal system in January 2012, we have not seen major departures from pre-2012 trajectories across measures of our portfolio with respect to PI or institution demographics or collaborations. Four years in, we have not seen indication of Division wide changes, especially any worsening of submission and award proportions among any of these major groups of concern. Success rates appear stable across multiple years for the first time in recent memory. However, the overall climate for awards remains poor due to continued funding stagnation. If there is any bright side to that fact, funding woes at least appear to not have been amplified for any particular subgroup in recent years. But, the limited purchasing power of program budgets means our ability to support the full diversity of the research community will continue to be tested and subject to difficult trade-offs.
[i] During the 13 years before preliminary proposals, DEB Core Program award numbers fluctuated quite a bit; they regularly rose or fell by 20-30 (and as many as 80!) awards per year.


Check your inbox.
Check your spam folder.
Complete the survey!
End the reminder messages.
This is about the Preliminary Proposal system in use in both NSF BIO’s Division of Environmental Biology and Division of Integrative Organismal Systems.
We are in the midst of an external evaluation of the effects of this system on the merit review process.
We posted an initial notification letter about stakeholder surveys. And, copies of this letter were sent out to everyone in the sample ahead of the formal invitations.
The formal survey invitations with the active survey links were sent out by mid-September from the evaluator, Abt Associates.
Reminder emails are also coming out and will continue to do so at regular interviews while the survey remains open and incomplete.
If you have been receiving these messages, please complete the survey. If your colleagues have been receiving these messages and have not completed the survey, encourage them to do so.
Thank you for your participation!


Posted by in core programs, data analysis, Discussion Forum, merit review, paperwork, preliminary proposals, reporting, service
Fiscal year 2015 has come to a close. With the dust settled, we can crunch the numbers on the DEB Core Program merit review and funding outcomes.
This post follows the format we’ve used in previous years. For a refresher, and lengthier discussions of the hows and whys of the metrics, you can visit the 2014 and 2013 numbers.
Read on to see how 2015 compares.
The charts below all reflect proportions of DEB Core Program projects through each stage of the review process: preliminary proposals, full proposals, and awards.
In the review process leading to awards in FY2015:
DEB reviewed 1590 preliminary proposals received under the DEB Core Programs solicitation and LTREB solicitation in January 2014, about 25% of which were invited to the full proposal stage.
The preliminary proposal invitees were joined at the full proposal stage by 1) Direct submissions to DEB under the CAREER, OPUS, and RCN solicitations, and 2) Projects shared for co-review by another NSF program. Altogether 510 full proposals were reviewed in DEB during October and November of 2014.
From this pool of full proposals, DEB made awards to 131 projects (technically, these were 193 separate institutional awards but for analysis purposes we count collaborative groups once, i.e., as a single proposed project).
Below, we present and discuss the Division-wide success rate and some selected project demographics that were raised as concerns coming in to the preliminary proposal system. The demographic numbers are presented as proportions for comparison across the review stages. However, the progressive reduction in size of the denominators from preliminary proposals (1590) to awards (131) means each step becomes more sensitive to small absolute changes.
The success rate for research proposals in the DEB Core Programs remains much as it was since the preliminary proposal process was instituted; success rate is a function of the number and size of requests submitted by the research communities and appropriated funding levels.
Reminder: Elevated success rates (in grey) were due to:
As seen in the figure below, there was little year-to-year change in the submission and funding success of single investigator projects.
 While the proportion of single investigator preliminary proposals declined slightly, there was no decrease when it came to either full proposals or awards. As a reminder to readers: most of the apparent increase in the proportion of single investigator projects between the preliminary proposal and full proposal stages is because the primarily single-investigator proposals in the CAREER and OPUS categories are not subject to the preliminary proposal screen and thus they make up a relatively larger portion of the full proposals. Similarly, the absence of CAREER and OPUS proposals at the preliminary proposal stage depresses the single investigator proportion of the preliminary proposal counts relative to the historical full proposal baseline.
The proportion of collaborative proposals in our award portfolio declined slightly from last year’s peak but is still above other prior years and doesn’t reverse the general upward trend over the past decade or so.
Readers may notice that the collaborative and single-investigator groupings don’t sum to 100%. The remainders are intra-institutional multi-PI arrangements; such projects are intellectual collaboration to be sure, but not a collaborative project per the NSF definition.
As we discussed in the FY2013 Wrap-up, there are several imperfect metrics for identifying early career investigators, with the “Beginning Investigator” check-box on the cover page being the most immediately visible but also the most inconsistently applied identifier. Beginning Investigator includes everyone who has never received federal funding, and many researchers don’t, so it is not as directly related to career stage as we may want to think it. For the purposes of measuring “Beginning Investigators” we use the response in the BIO Classification Form (this poses the same question as the cover page but captures a more complete record of response than a single a check box).
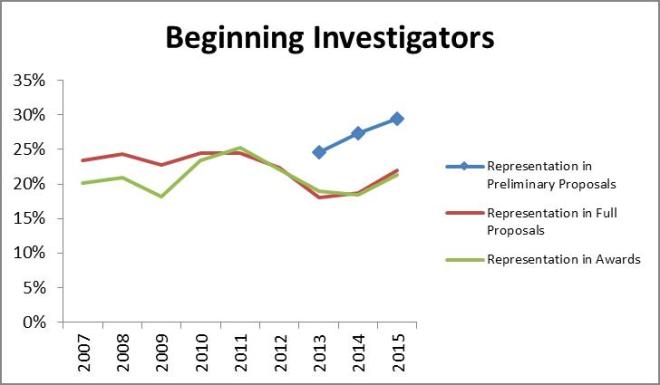 According to the classification form data, beginning investigators continue to receive awards in proportion to full proposal submissions but consistently represent a smaller segment of the proposal pool at these later stages than at the preliminary proposal stage[i].
The better identifier of researcher career stage is the years since PhD of the PI.
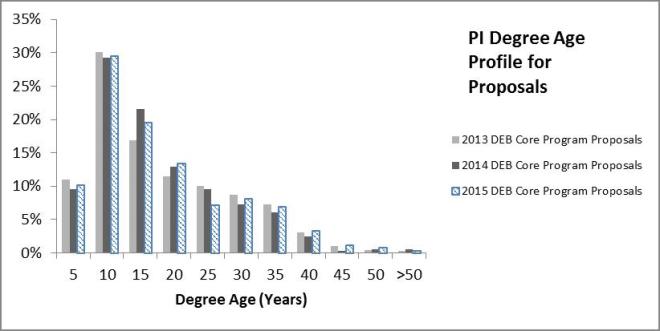
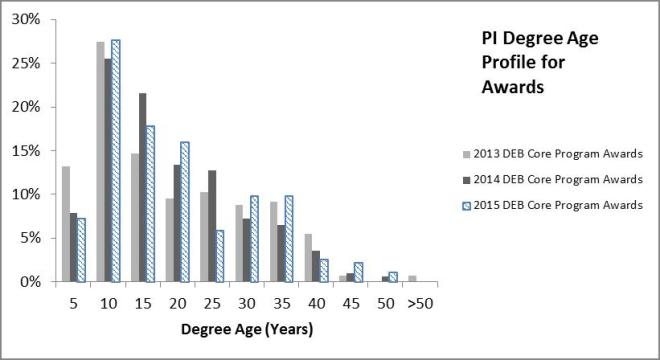
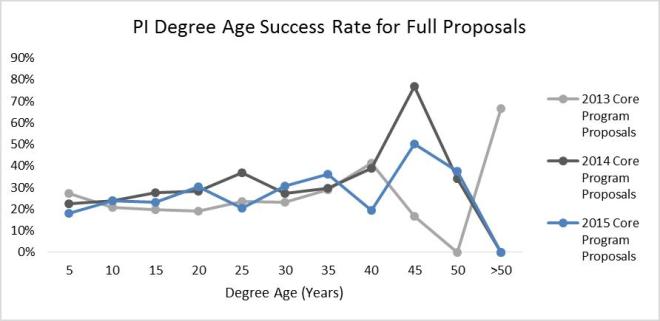 Little changed in the profile of submitter and awardee degree ages from 2013 through 2015. Success rate does not improve markedly with degree age and generally stays between 20-30% up through 35 years post PhD. PIs more than 35 years post-PhD are typically less than 5% of the total PIs on proposals and awards: too few in number to read much into the data. Early-, mid-, and later-career PIs appear to be faring equally well in core program award decisions.
Last year we saw what seemed like a potentially spurious but also curious pair of year to year changes in these groups: the proportion of PUI awardees jumped up at the same time as the proportion of female PIs slumped.
We thought these changes were spurious because the absolute numbers involved were small and potential confounding factors were numerous. That is, there are a range of factors beyond the summary rating of the panel such as nuances of the reviewer input, other demographic characteristics, additional funding, overlap with others’ awards, past productivity, etc., that weigh into each award decision. If only a few proposals satisfy any one factor, even fewer proposals will satisfy combinations of factors. Thus, a decision to make an award that boosts one aspect of portfolio diversity may come with an opportunity cost of not addressing another aspect.
We thought this was curious because, with PUIs experiencing a notable jump and female PIs a notable drop, these stood out visually from other results and related to preexisting areas of concern. And, this year we see another big change but in the opposite direction.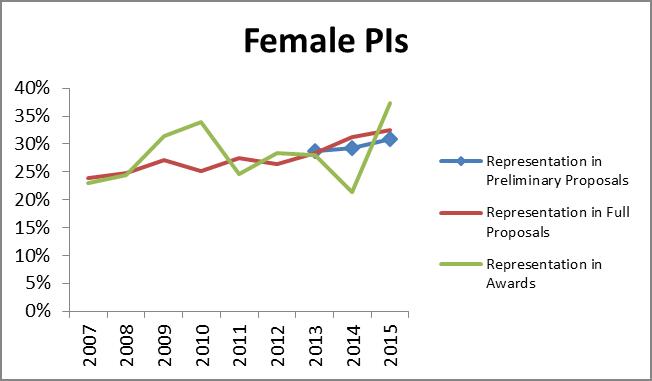

The first key thing to note is that there is no surprising up or down change in submissions of preliminary proposals or full proposals in either group since before the preliminary proposal system. That doesn’t take away, however, from the sudden appearance of negative reciprocal changes between award proportions for these two demographics seen in FY2014 and FY2015. On the other hand, there’s no trend (just greater variation), and there’s no direct mechanism we’ve been able to identify that would lend itself to management or modification.
Since the differences emerge only at the award stage, we continue to view this as we did last year. Since we don’t see a similar effect from preliminary proposal review and invitation decisions (yielding the full proposals), it seems likely that this is directly related to the final decisions regarding use of limited funds across too many strong candidates.
We conclude that we are witnessing a small numbers effect; 131 awards is simply not a sufficiently large “sample” to be representative of the population across all of the potential decision-making variables and concerns. PUIs are a minority component of the proposal pool (~18%). Female PIs are a minority component of the proposal pool (~30%). Beginning Investigators are a minority component of the proposal pool (~20%). Proposals that fall into two categories are an even smaller fraction of the proposal pool (~6%) and proposals that fit into all three are even smaller yet (~1%).
Since the implementation of the preliminary proposal system in January 2012, we have not seen major departures from pre-2012 trajectories across these measures of our portfolio with respect to PI or institution demographics or collaborations. Three years in, we have not seen indication of Division-wide changes, especially any worsening of submission and award proportions among any of these major groups of concern. Success rates appear stable across multiple years for the first time in recent memory. However, the overall climate for awards remains poor due continued funding stagnation. If there is any bright side to that fact, funding woes at least appear to not have been amplified for any particular subgroup in recent years. But, the limited purchasing power of program budgets means our ability to support the full diversity of the research community will continue to be tested and subject to difficult trade-offs.
[i] Two points we shared in our post from this past spring on individual success rates come to mind: the first years of the preliminary proposal system have seen a large uptick in first-time submitters, and only 25% of individual PIs received any funding from DEB over a 9-year period examined in that post. Lots of PIs have never, and will never, receive funding from us. In the context of the result above, we see the learning curve. There is a high failure rate: especially among PIs without prior funding success, but even among those who have been successful in the past. While a successful preliminary proposal from a would-be first-time PI goes on to compete on even footing with full proposals from experienced PIs, we don’t expect the preliminary proposals from all unfunded PIs to have the same distribution across the quality spectrum as those from previously successful PIs.


For any demographic analysis or comparison, NSF is reliant on the self-reported characteristics of participants in all phases of proposals and awards. Completion of the profiles is voluntary but critical for linking demographic data to proposal, funding, and review patterns. And, importantly, your profile provides the contact information that we use to reach out to you. So if your email address and institutional information are not up to date you may miss out on funding opportunities or critical notifications that affect your eligibility for funding.
So, is your FastLane PI profile complete, up to date, and error-free?
What about your OTHER FastLane profile? When was the last time you completed your Reviewer information?
Yes, that’s right; if you’ve taken part in both sides of the NSF merit review process you have two[i] separate FastLane profiles: one as a PI and another as a reviewer (or panelist).
Across NSF, our community members are pretty good about completing PI profiles (>80% coverage) but are far less likely to complete the profile as a reviewer (<<50% coverage).
Log in under “Proposals, Awards and Status”

(click images to enlarge)
You can go directly to your PI profile from the first landing page or update the information before starting work on a proposal.
The form itself includes your name, organizational affiliation, contact information, degree information, and demographic characteristics. (Screenshot below from the FastLane online Help guide.)

Before your next application, perhaps right now, please take the time to log in to FastLane and make sure your PI profile is up to date.
(As far as we know, though if you want to take a shot at logging in using a link in an old panel or ad hoc review invitation and find that it does let you access your profile, please tell us so we can update this accordingly.)
Panelists (https://meetings.nsf.gov/jsp/homepage/panelreview.jsp) and individual ad hoc reviewers (https://www.fastlane.nsf.gov/jsp/homepage/prop_review.jsp) have separate log-in pages on FastLane.
However, both take you to similar landing pages, and both provide the same options for updating a profile.

(Again, screenshots from the FastLane help guide.)
While you should confirm and take the time to correct any errors in your contact information, the most often missing pieces are demographic. [They’re even incomplete in the above Help Guide images!]
The reviewer demographic form asks the same questions and provides the same response options as the PI profile form.

So please, the next time you review for us, take a moment to complete your profile so we can put some data behind our efforts to make sure our review processes are representative of our communities.
Thanks!
[i] We’ve also noticed that a fair number of you have extra accounts lying around beyond those two; please call the FastLane Help desk to have that fixed.


Posted by in data analysis, DEB Explained, demographics, underrepresented groups
Our friends at Dynamic Ecology posted a little while back about the NSF-wide trends in per-person success rate based on this 2014 report to the National Science Board that provided merit review process statistics across the whole agency[i]. There were several questions in the comments to that post regarding the context for the numbers and how they would look for DEB or IOS, especially since preliminary proposals were explicitly excluded from the calculations in the report to the NSB[ii].
So, we’ve put something together with DEB data to follow-up on that discussion. Our analysis sticks to the general approach of the NSF-wide report with modifications to allow inclusion of preliminary proposal data.
First, let’s be clear about what we’re counting here. The NSB report’s Figure 14 illustrated a per-PI success rate based on counts of Competitive Research Grant Actions leading to Award or Decline decisions. That institutional jargon terminology specifies 3 different filters to define what was counted,
A context filter: Competitive (a stand-alone grant request) versus Non-competitive (changes to an existing grant such as a supplement or a PI move to a new institution) decision-making;
A content filter: Research (just what it sounds like, both Core and Special programs) versus Non-research (e.g., fellowships, dissertation support, travel support, conferences) activities;
An outcome filter: Awarded or Declined versus Any Other Outcome (e.g., invite, not invite, still pending a decision, returned without review, or withdrawn before a decision)
This is actually a really good set of filters for narrowing down the universe of “stuff NSF does” to questions about “bread and butter” grants. Ignoring the Any Other Outcome proposals is a good thing since those categories of proposals were never actually part of the competition in most cases across NSF. On the other hand, it complicates measurement of programs where large numbers of preliminary proposals are involved, as is our case.
Our first table presents the big picture of proposal submissions for DEB for a period of 2006-2014 (chosen mainly because that was the span of complete years beyond which the server was getting angry with us for requesting too many records, #overlyhonestmethods). We’ve divided them up following each of the filters mentioned above and also split out the DEB-relevant sub-units. (Note: for consistency across all of the different proposal types and with the NSF-wide data, this table counts separately all proposals with unique identification numbers in FastLane. This differs from the way DEBrief usually combines separate proposals from collaborative group into a single “project” unit for counts.)
 (click image to make legible)
We have discussed some of these trends before, but to quickly review the basic points:
1) Total actions spiked with the launch of the preliminary proposal system in 2012 but have since come down a bit. This was preceded by another spike in 2010 that was in part a reaction to stimulus funding in 2009 (evidenced by upward jumps in DDIGs, and Core programs from 2009-2010) and also a major spike in special programs that reflects the launch of Dimensions of Biodiversity and some other redistribution of special program responsibilities between Divisions in BIO.
2) Economic stimulus (ARRA) money in 2009 and the wiggle-room gained by clearing out some of the backlog of requests and paying down future commitments resulted in significantly elevated award counts in 2009 and 2010 that distort the longer-term pattern.
3) Incoming preliminary proposal numbers (2012-2014) have been nearly flat, as have the number of research grant award actions, especially when considering both core and special program components over the entire period.
We’re not adding per-proposal success rates to this table specifically because the preliminary proposal process crosses fiscal years and the corrections needed to account for the complexities of the process make that number very different from the straight-forward single-year data above (see endnote i). Per-proposal success rates are shown in our FY2014 wrap-up post.
Each action in the table from Part 2 links to a record of between 1 and 5 persons (PIs and CoPIs) on the proposal cover page.
[Contextual tangent: we are not differentiating between core and special programs in DEB for the per-person success rate. Could it be done? Sure, but the special programs and core programs are both funding research grants and we see that applicants to one or the other quite often switch targets depending on the convenience of deadline or opportunity. Ultimately getting one or the other provides the same result, research funding.]
In total, there were 11,789 unique PIs/CoPIs associated with the 20,724 Competitive Research Grant actions in DEB between 2006 and 2014. During the same time frame, DEB made 2,671 Competitive Research Grant Awards that included a total of 2,970 unique PIs or CoPIs. Most individuals (75% of unique PI/CoPIs) who applied to DEB for funding never received a Competitive Research Award during this entire 9-year period.
The NSB report calculated PI success rate in a 3-year moving window, we’ll do that in a moment. First, we want to split it a different way to account for the stimulus (ARRA) funding in 2009; when combined with the smoothing of the window, that spike in awards winds up distorting some details we’d like to explore.
| Fiscal Year | 2006 | 2007 | 2008 | 2009 | 2010 | 2011 | 2012 | 2013 | 2014 |
| Total Unique PIs and CoPIs Applied | 2052 | 2057 | 2060 | 2274 | 3266 | 2733 | 4310 | 4546 | 3950 |
| Unique Women Applied | 503 | 476 | 488 | 559 | 791 | 676 | 1127 | 1211 | 1093 |
| Total Unique PIs and CoPIs Awarded | 352 | 449 | 424 | 620 | 601 | 392 | 424 | 455 | 414 |
| Unique Women Awarded | 93 | 105 | 114 | 166 | 163 | 100 | 110 | 126 | 110 |
| Per-Person Success Rate |
17.2% | 21.8% | 20.6% | 27.3% | 18.4% | 14.3% | 9.8% | 10.0% | 10.5% |
| Per-Woman Success Rate | 18.5% | 22.1% | 23.4% | 29.7% | 20.6% | 14.8% | 9.8% | 10.4% | 10.1% |
| First Recordings of a PI | 2052 | 1149 | 909 | 1006 | 1553 | 943 | 1645 | 1542 | 990 |
| Last Recordings of a PI | 526 | 542 | 471 | 595 | 1085 | 780 | 1600 | 2240 | 3950 |
The notable patterns here:
1) The preliminary proposal system brought in a huge increase in persons applying each year, double pre-stimulus levels.
2) 2010 was a big year, matching what we saw in the proposal load table, with a large increase in people submitting in reaction to the economic stimulus (ARRA) and following the movement of special programs into DEB.
3) These additional PIs were actually “new” people who had not submitted to DEB since at least 2006; and, we saw about 50% higher numbers of new people for each of 2010, 2012, and 2013 than typical in previous years. But, 2014 looks more like the longer-term norm.
4) The stimulus funding had a big, but temporary, effect by allowing an extra ~200 persons to be funded in both 2009 and 2010. While the effect on per PI success was large in 2009, it was much less in 2010 because of the 1000 additional applicants that year.
5) Excepting the stimulus years, the number of persons funded by research grants doesn’t show a trend or even all that much variation over this span: ~420 unique persons per year.
6) The growth in unique PIs we see includes both an absolute increase and an increasing proportion of female investigators among applicants, although the temporal range is small and the female proportion of applicants has yet to exceed 28%. At the same time, women have generally experienced a per-person success rate (17.7 %) similar to that of the general population (16.7%).

There’s a legitimate question as to whether counting PIs and CoPIs provides the best metric of success. Perhaps we should count just PIs? This is what the NSB report does. However, at the preliminary proposal stage, with only a single proposal cover page per project team, there are many instances of collaborative PIs that appear as CoPIs as well as collaborative PIs and CoPIs that don’t appear on a cover page at all. The constraints of the FastLane submission system at the preliminary proposal stage generally lead to undercounting total participants and artificially inflating the balance of CoPIs relative to PIs[iii]. Counting only PIs causes two problems: 1) it ignores a portion of the population at the preliminary proposal stage that would have been counted on full proposals and 2) it would artificially raise the per-PI success rate under the two-stage process relative to the pre-2012 submission process. So, to reflect funding reality as best we can, we cast a wide net and include everyone from the cover pages in the calculations above. However, we can also look to see if the numbers come out any differently if we constrain our calculations to only PIs. Other than the counts being somewhat smaller, the per-person success rates are generally not changed and are tightly correlated with results shown above.
| Fiscal Year | 2006 | 2007 | 2008 | 2009 | 2010 | 2011 | 2012 | 2013 | 2014 |
| Total Unique PIs-Only Applied | 1299 | 1322 | 1358 | 1419 | 1973 | 1706 | 2390 | 2305 | 2140 |
| Unique Women Applied | 314 | 303 | 321 | 366 | 506 | 458 | 684 | 687 | 660 |
| Total Unique PIs-Only Awarded | 232 | 292 | 276 | 397 | 361 | 250 | 266 | 261 | 257 |
| Unique Women Awarded | 56 | 63 | 69 | 113 | 108 | 66 | 74 | 76 | 63 |
| Per-Person SuccessRate | 17.9% | 22.1% | 20.3% | 28.0% | 18.3% | 14.7% | 11.1% | 11.3% | 12.0% |
| Per-Woman Success Rate | 17.8% | 20.8% | 21.5% | 30.9% | 21.3% | 14.4% | 10.8% | 11.1% | 9.5% |

Based on the tight coupling of these measures, we continue with our analysis of per-person success using both PIs and CoPIs.
In comparison to the annual success rate data, many of the details noted above are paved over by the 3-year window method. We’re not disparaging this method; it is quite useful, especially during steadier budget times. Because the typical grant lasts 3 years, the 3-year success rate window roughly measures the percent of the active PI population that could be continuously funded under current expectations for the size and duration of grants. However, in the case where we have multiple shocks to the system occurring over the reporting period, it can generate misperception.
| Fiscal Window | 2006-2008 | 2007-2009 | 2008-2010 | 2009-2011 | 2010-2012 | 2011-2013 | 2012-2014 | |
| DEB | Unique PIs and CoPIs Applied | 4110 | 4303 | 5221 | 5563 | 6798 | 7354 | 7790 |
| Unique PIs and CoPIs Awarded | 1130 | 1361 | 1511 | 1475 | 1301 | 1162 | 1197 | |
| Per-Person Success Rate | 27.5% | 31.6% | 28.9% | 26.5% | 19.1% | 15.8% | 15.4% | |
| Per-Person Success Rate (PIs-Only) | 28.2% | 32.5% | 29.7% | 27.8% | 20.7% | 17.9% | 17.5% | |
| NSF-wide (From NSB Report) | Per-Person Success Rate (PIs-Only, excludes preliminary proposals) | 37% | 40% | 40% | 38% | 35% | 35% | TBD |
In this table, the windows affected by the extra stimulus (ARRA) funding are in italics and the windows affected by the new applicants to the preliminary proposal system are in bold. The 2010-2012 window sits at the intersection of the stimulus-elevated award numbers and preliminary proposal-driven increase in applicants. What we see here is that the pre-stimulus (2006-2008) and post stimulus (2011-2013 and 2012-2014) awardee numbers are quite similar. However, the applicant numbers have grown substantially, reflecting both the influx of new PIs in response to the stimulus and to the preliminary proposal system. This increase in the number of unique PIs/co-PIs applying in a given 3 year window drives the lower per PI funding success rate.
Notably, DEB’s per-person success rate is continually lower than the NSF-wide number but does follow the same pattern across the ARRA funding windows. The exclusion of preliminary proposal PIs from the NSF-wide counts leads to the increasing disparity between DEB and NSF-wide success rates from 2010-2012 onward.
We can also compare the annual and 3-year window measures to gain insight into another aspect of per-person success rate. A relevant concern we often hear is that “the same well-funded people just get funded over and over again”. If that were true, we would expect persons funded in year 1 of a window to be funded again in year 2 or year 3. So, the count of unique awardees in the 3-year window would be smaller than the sum of the annual counts of unique awardees (i.e., Dr. X is counted once in the three year window measure but twice, once in year 1 and once in year 3, by the annual measure). But, if grants were spread out (and thus, fewer PIs with overlapping/continuous funding), there would be many fewer repeat PIs so the sum of the annual counts would be much closer to the 3-year window count. In our case we have:
| Fiscal Window | 2006-2008 | 2007-2009 | 2008-2010 | 2009-2011 | 2010-2012 | 2011-2013 | 2012-2014 |
| 3-Year Count of Unique PI/CoPI Awardees | 1130 | 1361 | 1511 | 1475 | 1301 | 1162 | 1197 |
| Sum of Annual Unique PI/CoPI Awardee Counts | 1225 | 1493 | 1645 | 1613 | 1417 | 1271 | 1293 |
What this tells us is that fewer than 10% of awarded PIs in any 3-year window are repeat awardees during that period (~1.5 – 3.1% of all PIs who apply during that period).
If we step back and consider the whole 9 year period, we still find that the majority of PIs are funded only once.

Even if they were all 5-year grants, continuous funding of a lab from DEB research grants alone is extremely unlikely for the vast majority of PIs.
1) The number of people being supported on DEB research grants (~420 persons on new grants per year) hasn’t changed much over this period, except for the temporary shock of the economic stimulus.
2) The stimulus, and a 3-year method of smoothing, really messes with the general perception of funding rates. (We actually hadn’t really thought about that much except as the one-year outlier we usually label in our posts. This was eye-opening in that regard.)
3) Funding rates, both per-person and per-proposal, are being driven down by increases in the applicant/application pool: primarily growth in actual participant numbers but some intensification of per-person activity is also possible.
4) Of 11,789 unique PI/CoPI applicants, only 2,970 (25% of all applicants) received any funding over the 9-year period examined. Of those 2,970 to receive funding, only 772 received multiple awards (26% of awardees, 6% of all applicants) that could potentially maintain continuous “funding” over this period. Any person applying to DEB’s competitive research programs is unlikely to be funded, and much less likely to maintain continuous support for a lab from this single funding source.
5) Coming back to our original motivation for this post, per-person success rates for funding in DEB were consistently ~10 percentage points lower than the NSF-wide submission and funding data in years leading up to the preliminary proposal system. The exclusion of preliminary proposals from NSF-wide statistics has only deepened the apparent magnitude of this disparity in recent years and has even altered the trajectory of PI participant counts for the agency as a whole.
[i] The 2015 version of the report, with NSF-wide numbers through fiscal year 2014 should be arriving soon.
[ii] Why are preliminary proposals excluded?
The short answer is: the records don’t neatly match up.
The longer answer is: Beyond the major issue that the entire process from receipt of preliminary proposals through decisions on the related cohort of full proposals crosses fiscal years and so defies straight-forward binning, the path from individual preliminary proposal to award can be surprisingly non-linear. Our ability to accommodate these complexities comes at the expense of our ability to enforce strong rules to ensure continuity of the data you provide to us. Collaborative proposals are a prime example. In many cases not all PIs and CoPIs are actually listed on the cover page of the preliminary proposal. When a full collaborative proposal is invited it results in several different cover pages that each contain a different set of names. There’s no guaranteed 1-to-1 mapping of PIs across the entire process. Also, the basic ability to associate a full proposal with a preliminary proposal is tied to the “institution” which is the official owner of the proposals (not the PI). So if a PI changes institutions, or a collaborative reorganizes, or any number of other things that happen quite regularly comes to pass, the system doesn’t allow the full proposal to be linked to the actual preliminary proposal record. There are also people who receive an invite but then elect not to submit a full proposal for various reasons. On top of which you also have a number of CAREER-eligible PIs who (with or without an invite) will submit CAREER based on their preliminary proposal. The twists and turns are multitude and in the choice between flexibly accepting them and rigid data quality, we generally come down on the side of broad acceptance.
[iii] This is why we ask you to submit a personnel list by email and list all of the people on the 1st page of the preliminary proposal project description to ensure reviewers get the full info. Unfortunately, tying those names to FastLane records is not currently practical.


At the end of 2013, we presented DEB submission and award portfolio data examining the initial results of the preliminary proposal process, leading to DEB’s FY2013 awards. In this post, we provide a follow-up for the second round of awards funded under the preliminary proposal system in FY2014.
For a refresher, you can visit last year’s post.
The main takeaway from the 2014 data is that the following aspects of our portfolio do not exhibit changes associated with new system.
In FY2014, DEB awarded 136 core program projects (comprised of 197 separate awards). The numbers and charts below all reflect counts of projects.
These projects were selected from 520 full proposals reviewed in DEB during October and November of 2013 by invitation under the Core Programs and LTREB solicitations, via the CAREER, OPUS, and RCN solicitations, or as co-review with another NSF program. The invited proposals had been selected from among 1629 preliminary proposals initially submitted in January of 2013.
Below, we present and discuss charts tracking the trends for several dimensions of our project demographics that were raised as concerns coming in to the preliminary proposal system. The numbers are presented as proportions for comparison across the review stages. However, the progressive winnowing of total numbers from preliminary proposals to awards means each step becomes more sensitive to small absolute changes.
In all cases of award trends shown below, the absolute change from FY2013 to FY2014 was no more than 10 projects.
As seen in the figure below, there was little year-to-year change in the performance of single investigator projects, the small change being consistent with prior inter-annual variation. Most of the apparent jump in the proportion of single investigator awards between the preliminary proposal and full proposal stages is an artifact of the counting method. As we discussed last year, the primarily single-investigator proposals in the CAREER and OPUS categories are not subject to the preliminary proposal screen and thus they make up a relatively larger portion of the full proposals than in years prior to the system and their absence depresses the single investigator proportion of the preliminary proposal counts relative to the historical full proposal baseline.
Growth in the proportion of collaborative proposals in our award portfolio continues the generally upward trend from the past several years. We would expect a plateau at some point, but where that might be isn’t clear.
Readers may notice that the year-to-year increase in collaborative project awards for FY2014 is a few percentage points larger than the decrease in single investigator awards shown above. This difference reflects an increase in multi-institutional teams (which meet the NSF definition of “collaborative”) relative to intra-institutional arrangements (intellectual collaboration to be sure, but not a collaborative project).
Female PIs experienced a sizeable year to year drop in their proportion of awards this year, although the proportion of submissions at both preliminary and full proposal stages continues to increase. Such a drop is visually jarring, but not unprecedented. In absolute terms, this is a difference of eight projects across four clusters each with 1 or 2 full proposal review panels, essentially noise in the signal.

In contrast, PUIs experienced a large proportional increase in awards this year. Once again this is presumably due to noise within the programs’ decision-making (a difference of only 9 awards) since submissions did not change appreciably.

These single year changes in PUIs and female PIs appear to emerge from the full proposal review and program decision-making stage, not the preliminary proposal stage. This would seem to be a product of PO portfolio management, and such swings an inevitable result of the numerous dimensions of a “balanced portfolio” that need to be tended with a relatively small number of awards.
As we discussed in the FY2013 Wrap-up, there are several imperfect metrics of early career investigator performance, with the “Beginning Investigator” check-box on the cover page being the most immediately visible but also the most inconsistently applied identifier.
 By the check-box identifier, beginning investigators continue to receive awards in proportion to full proposal submissions. A gap between preliminary and full proposal submission is expected because of the influx of proposals from the CAREER, OPUS, and RCN mechanisms which tend to have lower rates of beginning investigator PIs in DEB. The proportion of checked boxes at the preliminary proposal stage may also be elevated since the box is commonly, but incorrectly, checked in reference to persons other than the PI and at the preliminary proposal stage that could include persons from non-lead collaborator institutions.
The other identifier of career stage is the years since PhD of the PI.
With “Early-career” < 10 year post-PhD, “Mid-career” as 10 – 20 years post-PhD, and “Advanced-career” as >20 years, we can give a broader and more accurate overview of the PI population.

From 2013 to 2014, the proportion of submissions decreased slightly for Early-career PIs (-2 percentage points), increased for Mid-career PIs (+6 pts) and decreased for Advanced-career PIs (-4 pts). Even with these changes, the Early-career cohort still represents the largest portion of submissions at 39%.
With respect to awardees, the PI profile shifted prominently toward Mid-career PIs from 2013 to 2014. That cohort increased by 10 pts to 35% of awards, which matches their submission rate. Advanced-career PIs dropped 3 pts, and make up the smallest portion of the award portfolio (32%) but their proportion of awards is still above submission levels. Early-career PIs represented a smaller portion of the 2014 awards (- 7 pts from 2013), and were somewhat underrepresented compared to submissions, constituting the remaining 33% of awards.
The changes in the awardee degree age profile from 2013 to 2014 resulted in a more even distribution between the three categories of Early-, Mid-, and Advanced-career but greater departures from their respective representation in submissions. However, it remains to be determined what distribution represents the “optimal” structure of the awardee population, or even on what criteria to judge optimality.
| Success Rate | |||||||||
| Fiscal Year | 2007 | 2008 | 2009 | 2010 | 2011 | 2012 | 2012/2013 | 2013/2014 | 2014/2015 |
| Preliminary Proposal* | 22.0% | 22.4% | 23.0% | ||||||
| Full Proposal** | 17.2% | 15.3% | 22.1% | 13.5% | 11.9% | 16.8% | 24.1% | 26.2% | N/A, awaiting budget |
| Overall*** | 17.2% | 15.3% | 22.1% | 13.5% | 11.9% | 16.8% | 7.3% | 7.6% | N/A, awaiting budget |
| *= Ninvited_full / Nsubmitted_preliminary | |||||||||
| **= Nawarded / (Ninvited_full + Ndirect_submission^) | |||||||||
| ***= Nawarded / (Nsubmitted_preliminary + Ndirect_submission^) | |||||||||
| ^Ndirect_submission = all proposals through 2012, after 2012 only CAREER, OPUS, RCN, co-review, and LTREB renewals taken to panel. | |||||||||
As we noted last year, we don’t put much value on “success rate” as a metric of program performance because it is driven by factors exogenous to DEB: the budget passed by Congress and the number and size of submissions sent in by the research community. However, we recognize its importance to you as a signal of program health and accessibility. In that regard, we are breathing a slight sigh of relief for the first departure, outside of extraordinary circumstances, from the downward slide that has dominated the past decade.


You may recall that way back in the first half of 2013 we invited the community by email and also via this blog to participate in a survey to gauge satisfaction with the preliminary proposal process in DEB and IOS.
The full results of the survey have now been published in BioScience. Our thanks to you for responding to our call to participate in great numbers and to the various discussants, readers, and reviewers who helped throughout the process.
We understand how strongly many people feel about these issues and appreciate your engagement as individuals with diverse experiences and perspectives. For every possible change we do or do not make, real lives are being impacted and that matters to us; and when 9 of 10 proposals are declined there will always be more individuals who “lose” than “win” even if the collective face of either group doesn’t change at all. We are ultimately people, trying to do our best to balance trade-offs with very real individual and collective consequences amidst constraints that extend well beyond any one of us. We are considering the responses very carefully, continuing to monitor outcomes, make adjustments, and evaluate the results of these changes with all available data.
Respondents were most satisfied with the preliminary proposal requirement and mostly dissatisfied with the switch to a single annual deadline.
The respondents indicated that they see the DEB and IOS changes as a potential threat to the success of several different groups, especially to the ability of early career faculty to obtain funding. After the first complete review cycle, there were no immediate and obvious changes to the representation of these groups in the award portfolio.
General consensus was seen in responses between DEB and IOS and across various demographic divisions.
http://bioscience.oxfordjournals.org/cgi/content/full/biu116?ijkey=WFhRM2sAgTLgzNa&keytype=ref (Web)
http://bioscience.oxfordjournals.org/cgi/reprint/biu116?ijkey=WFhRM2sAgTLgzNa&keytype=ref (PDF)
Note: you may hit a paywall if searching for the article directly from the web. These links should get you there directly.
and


This is a quick numbers post while we in DEB pivot from summer research and meeting outreach to fiscal closeout and autumn (full proposal) panel mode.
CAREER proposals in BIO were due on July 21, 2014. These proposals will be reviewed this fall and become part of the FY 2015 decision-making process. In this post, we take a look at the trends in submission of CAREER proposals through the current competition. We aren’t looking at funding rates or outcomes – those are beyond the scope of today’s post.
If you have no clue what a CAREER proposal is, skip to this short primer.
The CAREER program is a long-standing, foundation-wide opportunity for junior faculty. In DEB, CAREER proposals can provide eligible PIs an additional submission above and beyond the 2 allowed annually in the core programs.
Some DEB staff were concerned that we would see a substantial increase in CAREER submissions after the launch of the preliminary proposal process for the core programs. The reasoning was that CAREER-eligible junior faculty who were not invited to submit a full proposal would submit a CAREER instead. Alternatively, others pointed out that a competitive CAREER proposal differs substantially from a regular research proposal and that one does not simply flip a project idea from one to the other. Going in to the preliminary proposal system, it was an open question as to how CAREER submissions would respond.

Between 2002 and 2007, we received 40-60 CAREER proposals per year. There was rapid growth from 2008 to 2009 and 2010, well before the preliminary proposal process was launched, but that trend has not continued over the 5 subsequent deadlines. There is a jump in 2013, the first CAREER deadline after the switch to preliminary proposals, but that level has not been maintained. It appears that, 3 years in, we have not experienced a large shift of DEB proposals into the CAREER mechanism. Anecdotally, a few comments we’ve heard suggest that CAREER proposals continue to be seen as prestigious awards with high expectations at the review stage so many eligible PIs may be hesitant to apply. Supposing this view is sufficiently widespread it could easily suppress the numbers of PIs who would otherwise turn to this program after or instead of a core program submission.
While there was little change in CAREER submission numbers after the switch to the preliminary proposal system in DEB, the story is somewhat different in IOS (which instituted preliminary proposals at the same time) and MCB (which instituted a single deadline and PI submission limit of 1). Both of these Divisions also started from a very different place than DEB with respect to CAREER submissions. IOS and MCB received larger numbers of CAREER proposals than DEB in the years immediately prior to their respective review process changes and there are less tangible but important cultural differences in community expectations and approach to CAREER proposals. MCB was coming down from a submission peak (217 CAREER proposals) in 2006 and IOS was at a plateau ~110 following substantial submission growth in the early 2000s.
*The 2015 numbers may be revised if some submissions are returned as incomplete or out of compliance.
Both IOS and MCB experienced actual and proportionately larger initial jumps in CAREER submissions post-2012 than DEB. And, neither IOS nor MCB experienced a drop of similar magnitude to DEB during the second or third year since their solicitation changes. It’s not clear why the reaction in these two Divisions differed so much from the DEB communities. Potential reasons include: larger communities with larger potential for increases, influx of PIs from the biomedical community seeking funding, and differing perceptions and expectations for CAREER submissions relative to regular proposals.
Even though three years is a short run, CAREER submissions from 2013 onward in each of the three Divisions appear to be relatively stable. Concern about overwhelming growth in CAREER submissions has not been borne out. However, it is unclear why numbers went up and remained there in MCB and IOS but not DEB and what that means for us. Are DEB PIs and/or reviewers much more selective as to what they will put forward for a CAREER award? Do the demographics differ between the fields enough that we were already saturated with CAREER submissions while the other Divisions were not? Or is the variation stochastic? If anyone has data that might shed some light on these questions, we’d be happy to know.
CAREER is shorthand for the NSF-wide Faculty Early Career Development Program. The CAREER program is distinguished from other NSF opportunities by being exclusively for pre-tenured faculty and specifically focused on excellent educational aspects integrated with an outstanding research program. In addition to being considered a prestigious award in its own right, receipt of a CAREER award is a prerequisite of eligibility for the Presidential Early Career Awards for Scientists and Engineers (PECASE).
CAREER program submissions have a single annual deadline in mid-to-late July (exact date varies by directorate) and are reviewed by the most relevant disciplinary program. In DEB, CAREER proposals are taken to review in our fall full proposal panels, alongside invited full proposals, OPUS, and RCN submissions, and co-review proposals as we have previously illustrated. While not the normal practice in DEB, it is fairly common across NSF to have panels exclusively for CAREER proposals in programs where there are large numbers of CAREER submissions and/or no other close deadlines. [back to top]


Posted by in data analysis, DEB Numbers, demographics, Discussion Forum
Posted by in data analysis, Discussion Forum