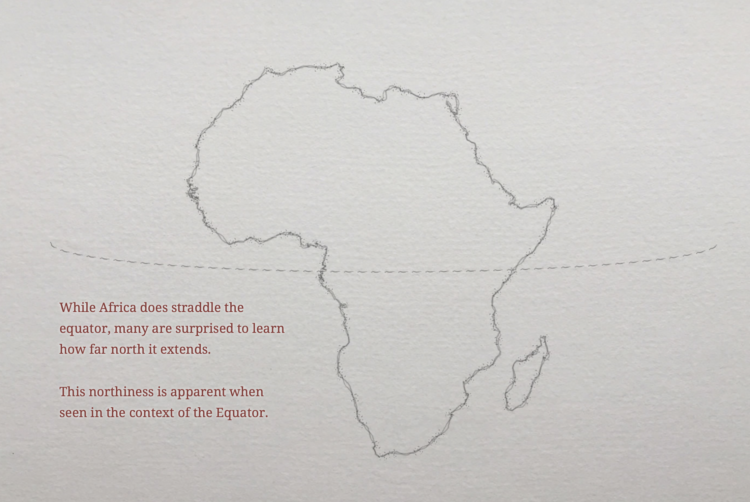
Geographic misconceptions about the location of continents

When you’re used to looking at the world through a certain lens, such as a certain rectangular geographic projection, your mental model tends to mirror the view. John Nelson goes over a handful of misconceptions, through the eyes of North Americans.

Tags: , ,

Inside out map of the Grand Canyon

John Nelson turned the Grand Canyon inside out to understand the magnitude better:

Some of my earliest memories of the place had to do with the trippy feeling of my eyes and mind trying to make sense of the scale. I had seen many mountain ranges and vistas, including some on the way, but the vast negative space played havoc with my perception of magnitude. I’ve felt it a few times since, but never like that first Grand Canyon overlook.

Instructions included on how to do this in ArcGIS Pro.

Tags: ,

Mortgages in terms of years of working life

Buying a house is often confusing and complex, compounded by a dollar sign followed by too many commas and zeros. So John Nelson broke it down to something more simple. How many annual salaries would it take to buy a house? He applied it to his own family situation and then expanded it to the country on a county level.

Of course that’s not how mortgages actually work. It’s much worse than that. But this was the concrete visual of the trade required to land a house. I felt the Nelson family had no future there, if our plans in any way involved home ownership.

How many working years will it take you?

Tags: , ,

Shift in world’s night lights

NASA recently released composite images of the Earth at night based on 2016 data, which was a follow-up to similar images for 2012. John Nelson compared the two, specifically looking for new lights that came on (blue) and lights that went off (pink). The former, suggesting growth and the latter, suggesting decline.

Full zoomable version of the Earth here.

Tags: , ,

Glow map

Firefly maps

John Nelson has a knack for making maps that glow, where the base map serves as a dark backdrop and the data of interest sort of lights up. In a recent talk, he calls it Firefly Cartography and explains its use in presentation and in education.

A firefly map is to regular thematic maps the way that a lightsaber is to swords. Thematic layers that look like they are etched with white hot plasma tend to draw eyeballs and provide a sense of intensity that solid Boolean symbology just doesn’t offer. I think we are wired to notice and note things that glow. Whether it is marking time by the sun or moon, staring into embers, watching for nighttime travelers by the open flame they carry, or noting the churned phosphorescence of the sea, we historically have done well to note the things that glow.

I suspect firefly charts would be equally expressive.

Tags: , ,

Moving drought boundaries

Moving drought boundaries

Drought continues to trudge along. My grass is just about dead, save a few hearty patches clinging on to the last few drops in the soil. Sad state of affairs it is. Drought is not static though. The boundaries move and the levels change, which is what John Nelson mapped in an overlay of five years of drought in the United States, based on data from the Drought Monitor.

We’ve seen this as small multiples and animated maps, but I like how this static boundary version gifts a sense of shift without actually moving.

Grab the aggregated data here.

Tags: ,