Counting the numbers in the news

Truth and Quantity

Truth & Quantity by Gregor Hochmuth is what happens when you strip out all context from an NPR newscast and only look at the numbers.

Every day at 8am and 8pm, Truth & Quantity transcribes NPR’s hourly news update using speech recognition & natural language analysis. It then selects all plural nouns from the news script and generates two compilations: one for each month (going back to 2009) and another for various quantities, such as all instances of “7” or “100 million.”

Click on any number to get more of a sentence.

Good stuff. Find out more here.

Tags: ,

Power sources in each state

Power source in each state

In a clean and simple set of slope charts, Alyson Hurt for NPR shows the shifts in power sources — coal, gas, nuclear, hydroelectric, and renewables — from 2004 to 2014. As you might guess, coal power output is down in most states and natural gas is up. On a national scale, the hydroelectric and renewable sources need more time.

Grab the data from the U.S. Energy Information Administration to look yourself.

Tags: ,

Top high school plays and musicals, by decade

Top plays rank over time

Based on annual high school play and musical rankings from the magazine Dramatics, which date back to 1938, NPR charted the most popular plays by decade. For a variety of reasons — cast size, family-friendliness, and licensing — the oldies still reign.

There are two views. In one, the top six plays/musicals are shown each decade and colored by when they were first produced. Mouse over a play, and it's highlighted in the other decades if it's at the top.

The second, more interesting view shows rankings over time. Select a play from a dropdown and see the ups and downs among the top ten, as shown above.

A part of me wants to see and do more with that second view. You could show more rankings at one time instead of just the top ten. You should show all the plays at once. You could add an interaction to mouse over plays in any column to get the full ribbon across. You could then provide a search bar instead of dropdown menu for all the plays over the decades.

But for the article's audience and in the context of the story? This version works much better. Because more isn't always best.

See it.

Tags: , ,

Disaster risk indices estimate impact on people

Disaster risk

An earthquake with a magnitude of 7.8 can affect countries differently, depending on the people's ability to withstand and recover from such a disaster. INFORM attempts to assess this risk, so that organizations can make better-informed decisions about what relief to send. Greg Myre for NPR explains with a heatmap. [via @onyxfish]

Tags: ,

Growth of urban neighborhood Wal-Mart

Wal-Mart

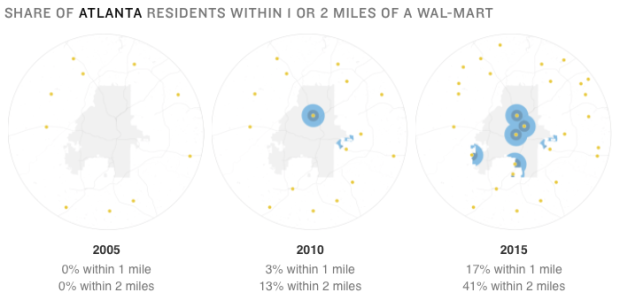
Maybe you saw the Wal-Mart growth map I made a while back. NPR takes a much closer look at Wal-Mart's current growth strategy, as the store goes smaller and caters to more urban areas. That means less heads of lettuce and more pre-made salads.

NPR focused on the percentage of three city populations that are near a Wal-Mart:

An NPR analysis found that in 2005, none of Washington's 600,000 residents were within 1 mile of a Wal-Mart store. Today, almost 13 percent are. Chicago has experienced an even more dramatic transition. In 2005, only one-half of 1 percent of the city's 2.7 million residents lived within 1 mile of a Wal-Mart. Today, more than 22 percent do. (All estimates are based on 2010 U.S. Census population numbers.)

Yay?

Tags: ,

Decline of women in computer science

Women in computer science

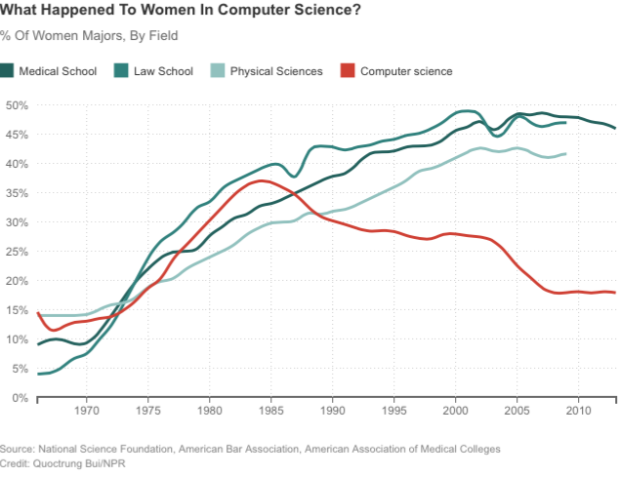
NPR spent some time on the subject of the decline of women in computer science. Whereas the the percentage of women in other technical fields rose, the percentage of women in computer science declined, as shown in the chart above. Although it's tough to pinpoint a single factor, the time of decline coincides with when computer were mostly marketed towards boys in the 1980s.

In the 1990s, researcher Jane Margolis interviewed hundreds of computer science students at Carnegie Mellon University, which had one of the top programs in the country. She found that families were much more likely to buy computers for boys than for girls — even when their girls were really interested in computers.

Tags: , ,