Food shortage in a height chart

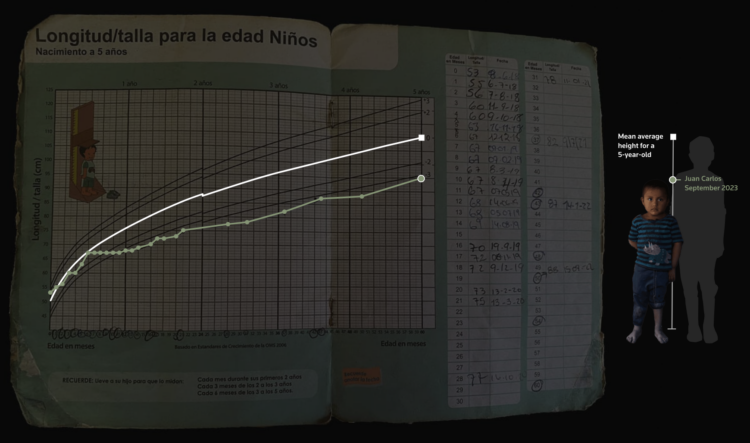
There are food shortages in Guatemala. For Reuters, Cassandra Garrison, Clare Trainor and Sarah Slobin used a height chart to show stunted growth as an indicator.

A few tortillas and a half bowl of reheated beans were all Maria Concepcion Rodriguez had to feed her six children in the isolated village of El Aguacate, one day in August.

Only her three-month-old breastfed baby had height commensurate with her age. The others were stunted by undernourishment. They looked too young for their years.

Tags: , ,

Where the clouds are the highest

Cloud formation depends on temperature and moisture levels, so in places of high humidity like the East Coast and Pacific Northwest, the clouds form lower. In dryer places like the southwestern United States, the clouds don’t form until higher up. For The Washington Post, Kasha Patel and Dylan Moriarty have the maps that show the contrast over the seasons.

Tags: , ,

Why South Koreans grew taller so quickly

As a world population, we’re growing taller, but South Koreans seemed to grow a lot quicker over the past century. Vox breaks down height distributions and explains the increased rate in South Korea in their Vox-y combination of paper, slides, and digital. Wealth and improved food supply appears to have helped things along.

There’s one part when the narrator Alvin Chang says he has to adjust the vertical axis to see the change in height better. My chest might have tightened as my mind went to bar-charts-start-at-zero land, but the bar chart in the video switches from height to change in height, so it was all okay. Phew.

Tags: , ,