Working the triple peak

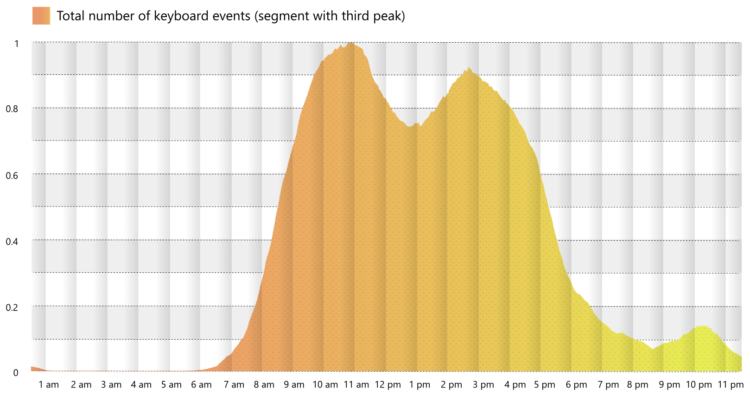
Microsoft researchers analyzed keystrokes by time of day, for a sample of Microsoft employees during this past summer. You can see the typical peaks during work hours with a dip for lunch. But among 30% of workers in the sample, there was a third peak starting around 9 o’clock in the evening.

That third peak felt too close to home for me.

Tags: , ,

Most people think their employers don’t care about their well-being

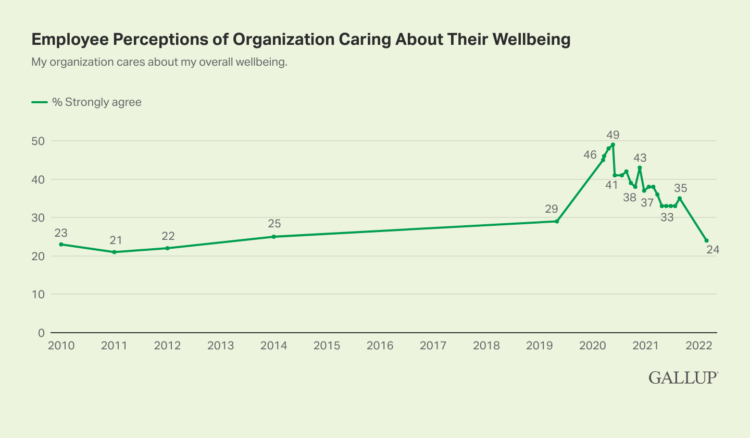
Based on polls by Gallup, almost half of U.S. employees thought their employers cared about their well-being early on in the pandemic. That sentiment did not last:

Fewer than one in four U.S. employees feel strongly that their organization cares about their wellbeing — the lowest percentage in nearly a decade.

This finding has significant implications, as work and life have never been more blended and employee wellbeing matters more than ever– to employees and the resiliency of organizations. The discovery is based on a random sample of 15,001 full and part-time U.S. employees who were surveyed in February 2022.

This seems not good? Or maybe it’s just life’s terrible way of saying it’s healing.

Tags: , , ,

Simulating how just a little gender bias in the workplace can lead to big effects up the chain

Yuhao Du, Jessica Nordell, and Kenneth Joseph used simulations to study the effects of small gender biases at entry level up to executive level. It doesn’t take much to skew the distribution. For NYT Opinion, Yaryna Serkez shows the simulation in action with moving bubbles and stacked area charts for each work level.

The simulation imagines a company where female performance is undervalued by 3 percent. Each dot represents an employee, and they either move up with promotions or stay still. The distribution of men and women start even but end very uneven.

Tags: , , ,

Social distancing when we’re back in the office

For Reuters, Sarah Slobin and Feilding Cage imagine life back at the office with an interactive game. Navigate through different office scenarios while maintaining social distance:

To understand what that might feel like, we spoke to some experts on work and workspaces who predicted that social distancing measures and hybrid work models are here to stay. Walk through our simulations below to experience what going back to the old/new office might be like. Make sure to avoid contact with others along the way!

I haven’t worked in a proper office in many years, and it never appealed to me, but it sounds pretty nice these days.

Tags: , , , , ,

Not so likely life of The Simpsons

For The Atlantic, Dani Alexis Ryskamp compares the financials of The Simpsons against present day medians, arguing that the fictional family’s lifestyle is no longer attainable:

The purchasing power of Homer’s paycheck, moreover, has shrunk dramatically. The median house costs 2.4 times what it did in the mid-’90s. Health-care expenses for one person are three times what they were 25 years ago. The median tuition for a four-year college is 1.8 times what it was then. In today’s world, Marge would have to get a job too. But even then, they would struggle. Inflation and stagnant wages have led to a rise in two-income households, but to an erosion of economic stability for the people who occupy them.

Someone should take this a step further and look at distributions and time series to show the shift, with The Simpsons as baseline.

Tags: , , , ,

Historical cost of light

These days, most of us don’t have to do much to turn on a light when it’s dark out. But what if I told you it used to take a lot more time and money to get that sweet artificial light? For The Pudding, Ilia Blinderman and Jan Diehm equate scrolling down one pixel to one second for an average waged worker. See how much you have to scroll/work to earn one hour of light.

Tags: , , ,

Remote work and industry

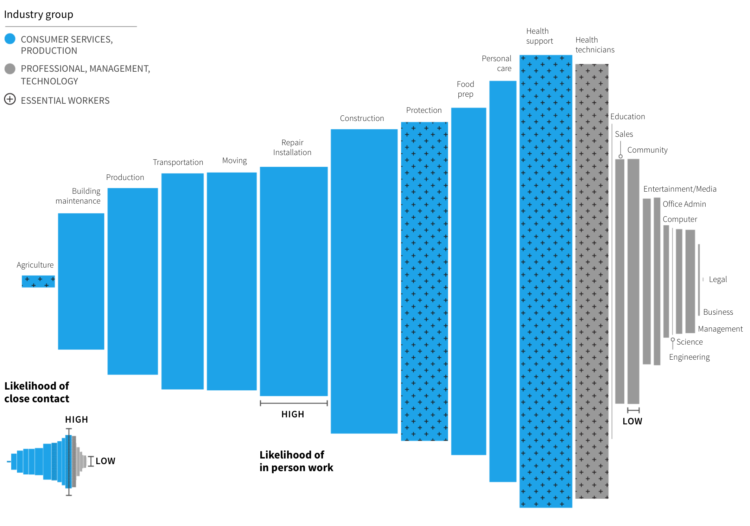
Some industries are more compatible with remote work than others. Jonathan I. Dingel and Brent Neiman at the University of Chicago estimated the scale of the differences. For Reuters, Sarah Slobin reports using a variable width bar chart to show likelihood of close contact with others against likelihood of in person work:

Professional, management and technology jobs run the gamut from accountants and architects to lawyers, insurance underwriters and web developers. This group is much more likely to retain the privilege of collecting a paycheck while working remotely, and is based in major metropolitan areas, like New York and Los Angeles.

See additional breakdowns by geography and job loss.

Tags: , , , ,

Most Common Jobs, By State

Instead of looking at only the most common job in each state, I found the top five for a slightly wider view. You still see the nationally popular occupations — drivers, cashiers, and retail workers — but after the first row, you see more regional and state-specific jobs.

The sore thumb in this picture is Washington, D.C., whose top five ordered by rank was lawyers, management analysts, administrative assistants, janitors, and, wait for it, chief executives.

Next step: compare metro areas instead of states for something more apples-to-apples.

Working With Choropleth Maps and Shapefiles

Here’s a tutorial on how to make maps like the above.

Notes

  • The Current Population Survey is an ongoing survey conducted by the United States Census Bureau. The downloaded microdata from IPUMS CPS for May 2015 through May 2018.
  • I made the maps in R and edited in Adobe Illustrator.
  • Like Quoctrung Bui’s map for NPR (which stirred my curiosity), I filtered out the “all other” manager and sales workers, which serve as catch-all categories for jobs that didn’t fit anywhere else.

Tags: ,

Umpire strike zone changes to finish games earlier

When watching baseball on television, we get the benefit of seeing whether a pitch entered the strike zone or not. Umpires go by eye, and intentional or not, they tend towards finishing a game over extra innings. Michael Lopez, Brian Mills, and Gus Wezerek for FiveThirtyEight:

The left panel shows the comparative rate of strike calls when, in the bottom of an inning in extras, the batting team is positioned to win — defined as having a runner on base in a tie game — relative to those rates in situations when there’s no runner on base in a tie game. When the home team has a baserunner, umps call more balls, thus setting up more favorable counts for home-team hitters, creating more trouble for the pitcher, and giving the home team more chances to end the game.

I doubt the shift is on purpose, but it’s interesting to see the calls go that way regardless. Also, from a non baseball-viewer, why isn’t there any replay in baseball yet?

Tags: , , ,

Stack Overflow salary calculator for developers

Stack Overflow used data from their developer survey to build a prediction model for salary, based on role, location, education, experience, and skills. The result was a salary calculator that you can use to gauge how much you should be making.

In this salary calculator, we report a predicted salary for the location, education, experience, and other information you enter. We also report a 50% prediction interval. The specific statistical meaning of this interval is that we expect 50% of people with the same characteristics as you to have salaries within that range; it spans the 25th to 75th percentiles. The interval is just as important as the prediction itself (the 50th percentile), because it gives you an understanding of what the range of expected salaries could be.

Nifty.

Tags: , ,