Mapping all of the voters

In what seems to have become a trend of making more and more detailed election maps, NYT’s The Upshot mapped results down to the addresses of 180 million voters:

The maps above — and throughout this article — show their estimates of partisanship down to the individual voter, colored by the researchers’ best guess based on public data like demographic information, voter registration and whether voters participated in party primaries.

We can’t know how any individual actually voted. But these maps show how Democrats and Republicans can live in very different places, even within the same city, in ways that go beyond the urban-suburban-rural patterns visible in aggregated election results.

The estimates are based on research by Jacob Brown and Ryan Enos, recently published in Nature. You can also look at their data via the Harvard Dataverse.

Tags: , ,

Segregation compared during work and at home

Based on commuting data from the Census Bureau, researchers Matthew Hall, John Iceland, and Youngmin Yi tracked segregation during the day and night. Alvin Chang for Vox mapped their results:

They found that when white people go to work, they are around only slightly more people of color than when they’re in their home neighborhoods. But for everyone else, going to work means being exposed to many more white people — and far fewer people of their own race.

Browse the map to see the results for your own city.

It appears that the 3-D map is making a small comeback (Thanks, Matt Daniels), to the delight of some and perhaps to the chagrin of others. I’m ready for it. I wonder when data graphic résumés are coming.

Tags: , ,

Understanding segregation with a simulation

Segregation simulation

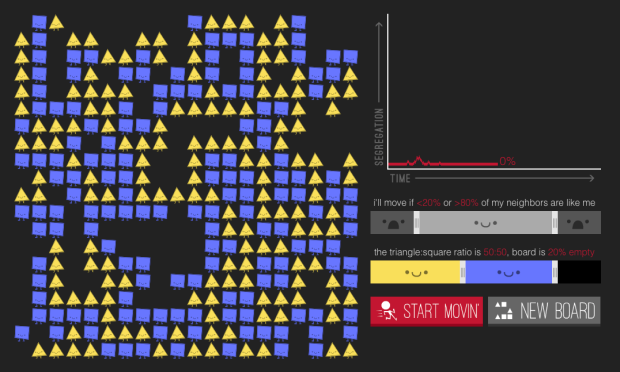
In 1971, Nobel laureate economist Thomas Schelling proposed that a desire to have neighbors of the same race — even a small percentage — can lead to segregation. The model has been simulated through a variety of interactives before, but in Parable of the Polygons, Vi Hart and Nicky Case put extra effort into teaching the model, bringing playfulness to an otherwise serious subject.

Two groups of people are encoded as shapes — squares and triangles — and they take you through each step of the model. Use the sliders to adjust thresholds and population distributions, and run the simulation. The shapes on the left move if they're looking for similarity, and the line chart on the right shows segregation over time.

You end up with an understanding of how segregation works (however simplified this model might be) and a glimmer of hope of how we might shift directions.

Worth a try.

Tags: ,