Python is coming to Excel

Excel is getting a bump in capabilities with Python integration. From Microsoft:

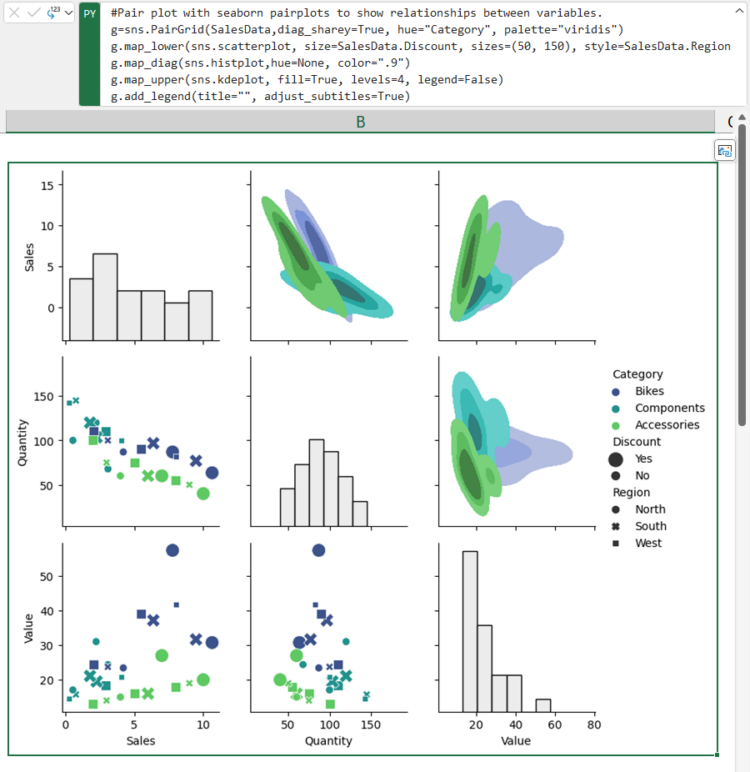
Excel users now have access to powerful analytics via Python for visualizations, cleaning data, machine learning, predictive analytics, and more. Users can now create end to end solutions that seamlessly combine Excel and Python – all within Excel. Using Excel’s built-in connectors and Power Query, users can easily bring external data into Python in Excel workflows. Python in Excel is compatible with the tools users already know and love, such as formulas, PivotTables, and Excel charts.

Sounds fun for both Excel users and Python developers.

It’s headed to the Beta Channel in Excel for Windows and then Excel for Windows proper. They didn’t announce a timeline for Mac.

Tags: ,

Introduction to statistical learning, with Python examples

An Introduction to Statistical Learning, with Applications in R by Gareth James, Daniela Witten, Trevor Hastie, and Rob Tibshirani was released in 2021. They, along with Jonathan Taylor, just released an alternate version with applications in Python. So if Python is your thing, have at it. Like the R version, it is free to download as a PDF.

Tags: , ,

Switching from Python to R

If you’re looking to switch or just want to expand your skills, this starter guide by Stephanie Lo provides some translations:

Are you curious about delving into the world of R programming? While Python remains the dominant choice amongst the data science community, with approximately 60% of developers using it in 2022, there are instances where R may pop up now and again. That’s because R is optimized for statistics and data. If you, like me, have a foundation in Python but now encounter job listings and internal company tasks that demand R skills, this article aims to break that down. We will explore the fundamental distinctions between Python and R and wrap the project into a data cleaning and visualization tutorial to ensure a smooth transition to R.

I mostly use R, but have always found it helpful to know some Python, especially when there’s some fun library to try.

Tags: , ,

Introduction to Deep Learning

Sebastian Raschka made 170 videos on deep learning, and you can watch all of the lessons now:

I just sat down this morning and organized all deep learning related videos I recorded in 2021. I am sure this will be a useful reference for my future self, but I am also hoping it might be useful for one or the other person out there.

It’s split into 19 lessons over five parts: introduction, mathematical foundations, neural networks, deep learning for computer vision, and generative models. Might be useful, even if you just want to learn more about machine learning is.

Tags: , ,

Spatula, a Python library for maintainable web scraping

This looks promising:

While it is often easy, and tempting, to write a scraper as a dirty one-off script, spatula makes an attempt to provide an easy framework that most scrapers fit within without additional overhead.

This reflects the reality that many scraper projects start small but grow quickly, so reaching for a heavyweight tool from the start often does not seem practical.

The initial overhead imposed by the framework should be as light as possible, providing benefits even for authors that do not wish to use every feature available to them.

Although, without my dirty one-off scripts, what will I put in my tmp data folder?

Tags: ,

Generate a color analysis by uploading an image

Mel Dollison and Liza Daly made a fun interactive that lets you upload an image, and it spits out a vintage-looking color analysis a la Vanderpoel:

This generator is based on the works of Emily Noyes Vanderpoel (1842-1939), who hoped her original color analyses would inspire others to study “whatever originals may be at hand in books, shops, private houses, or museums.” We hope you are similarly inspired by her abstract, modernist style employed in the context of everyday objects and photos.

Originally conceived as a Twitter bot, you can find the Python code behind the project on GitHub.

Tags: , , ,

Altair for visualization in Python

Vega-Lite is a grammar for interactive graphics primarily used for analysis. Altair is a visualization library in Python that is based on this grammar.

With Altair, you can spend more time understanding your data and its meaning. Altair’s API is simple, friendly and consistent and built on top of the powerful Vega-Lite visualization grammar. This elegant simplicity produces beautiful and effective visualizations with a minimal amount of code.

Jim Vallandingham just put up a useful introduction to the library if you’re looking to get your feet wet.

I do very little visualization-wise with Python since my current toolset typically covers my bases, but this has me curious.

Tags:

Posted by in Python, software

Tags:

Permalink

Extracting NBA player movement data

Player movements

NBA basketball teams have tracking systems installed in their arenas called SportVu, essentially a system of cameras pointed at the court to track player movements. Some of that data is browsable through the NBA site, but there's understandably no direct download link. However, there is an API. Savvas Tjortjoglou wrote a thorough tutorial on how to grab data via the API and plot it Python.

This will be fun.

Tags: , , ,

Ditch Excel and format your data with csvkit

I thought I linked to csvkit a while ago, but apparently not. If you deal with CSV data at all, you should know about the utilities suite that helps you format and re-format in various ways. Christopher Groskopf posted a list of quick things you can do with csvkit.

Over the last several months there have been two major releases of csvkit. These releases have brought long-awaited features such as Python 3 support, a csvformat utility and a new csvkit tutorial—not to mention a slew of bug fixes. To celebrate the latest release, here are eleven of my favorite awesome things you can do with csvkit. If you aren't using it yet, hopefully this will convince you.

Fun things include a quick one-liner to convert an Excel file to CSV, switching to JSON, and easy CSV export from a database.

Tags: ,

Posted by in csv, Python, software

Tags: ,

Permalink

PlotDevice: Draw with Python

PlotDevice

You've been able to visualize data with Python for a while, but Mac application PlotDevice from Christian Swinehart couples code and graphics more tightly. Write code on the right. Watch graphics change on the right.

The application gives you everything you need to start writing programs that draw to a virtual canvas. It features a text editor with syntax highlighting and tab completion plus a zoomable graphics viewer and a variety of export options.

PlotDevice's simple but com­pre­hen­sive set of graphics commands will be familiar to users of similar graphics tools like NodeBox or Processing. And if you're new to programming, you'll find there's nothing better than being able to see the results of your code as you learn to think like a computer.

Looks promising. Although when I downloaded it and tried to run it, nothing happened. I'm guessing there's still compatibility issues to iron out at version 0.9.4. Hopefully that clears up soon. [via Waxy]

Tags: ,