How sports owners pay less taxes than athletes

ProPublica continues their analysis of an anonymous dump of tax records, this time with a focus on billionaire sports owners:

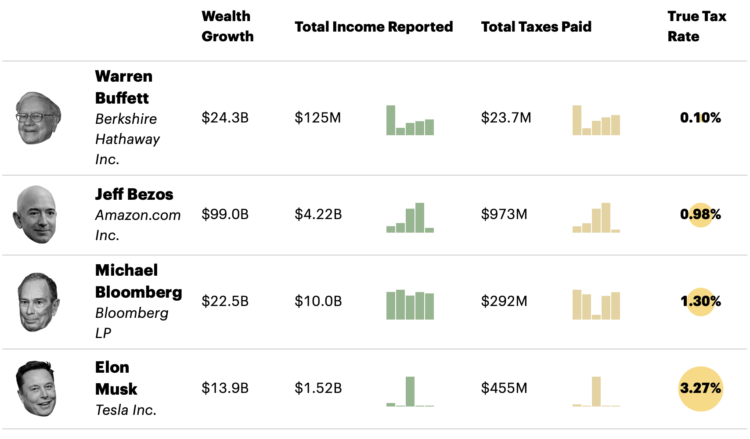
The law favors people who are rich because they own things over people who are rich because they make a high income from their work. Wages — the main source of income for most people, including athletes — are taxed at the highest rates of all, topping out at a marginal rate of 37% plus an extra 3.8% for Medicare. The government takes a smaller share of money made from, say, selling a stock. That’s not to mention the benefits available to people who own businesses, such as the paper losses created by buying a sports team.

Easy solution: We’ll all just buy a sports team.

Tags: , , ,

How the ultrarich use a Roth IRA to get more rich

ProPublica continues their analysis of an anonymous IRS tax records dump. In their most recent, they look at how Peter Thiel uses a Roth IRA to avoid taxes on billions.

In the second half of the piece, a time series chart showing the growth of Thiel’s account versus a standard maxed out account. The data progresses as you scroll, which moves the article forward, until it fills the whole window. Nice.

Tags: , , ,

Billionaire tax rates

ProPublica anonymously obtained billionaires’ tax returns. Combining the data with Forbes’ billionaire wealth estimates, ProPublica calculated a “true tax rate” for America’s 25 richest people:

The results are stark. According to Forbes, those 25 people saw their worth rise a collective $401 billion from 2014 to 2018. They paid a total of $13.6 billion in federal income taxes in those five years, the IRS data shows. That’s a staggering sum, but it amounts to a true tax rate of only 3.4%.

It’s a completely different picture for middle-class Americans, for example, wage earners in their early 40s who have amassed a typical amount of wealth for people their age. From 2014 to 2018, such households saw their net worth expand by about $65,000 after taxes on average, mostly due to the rise in value of their homes. But because the vast bulk of their earnings were salaries, their tax bills were almost as much, nearly $62,000, over that five-year period.

As you might guess, a lot of the disparity has to do with wealth held in unrealized capital gains. The other part is how the ultrawealthy still pay for everything when most of their money is in investments and how that factors into deductions.

Tags: , , ,

Inadequate hate crime statistics

For ProPublica, Ken Schwencke reports on a poor data system that relies on local law enforcement to voluntarily enter data:

Local law enforcement agencies reported a total of 6,121 hate crimes in 2016 to the FBI, but estimates from the National Crime Victimization Survey, conducted by the federal government, pin the number of potential hate crimes at almost 250,000 a year — one indication of the inadequacy of the FBI’s data.

“The current statistics are a complete and utter joke,” said Roy Austin, former deputy assistant attorney general in the Department of Justice’s civil rights division. Austin also worked at the White House on data and civil rights and helped develop an open data plan for police data.

Garbage in, garbage out.

Tags: , , ,

Parler video feed of the mob at the Capitol

As you probably know, there was a big Parler data scrape before the app and site went down. ProPublica spliced Parler video posts, sorting them by time and location. The result is basically a TikTok-style video feed of what happened.

Tags: , ,

Mapping disappearing beaches in Hawaii

Ash Ngu for ProPublica and Sophie Cocke for Honolulu Star-Advertiser show the harm of building seawalls on Hawaii’s beaches. The walls protect luxury beachfront properties, but they have been built through administrative loopholes and destroy beaches, which are owned by the public.

I like the combination of video footage and map, providing a scroll along the coastline. It provides an anchor for where you are and what you’re looking at.

Tags: , , , ,

Long-term timelines for judicial appointments

Federal judge appointments are for a lifetime, so the younger a judge is appointed, the more potential years they can serve. For ProPublica, Moiz Syed charted age, time of appointment, and average retirement age to show how current appointments can make impact for decades.

Tags: , , ,

More fire weather days coming

It’s been smoky this season. Based on research from Michael Goss et al., Al Shaw and Elizabeth Weil for ProPublica look at the current fire situation in California and what that might mean for the future and the rest of the country.

In wildfires, as with flooding and heat, climate change doesn’t create novel problems; it exacerbates existing problems and compounds risks. So there is no precise way to measure how much of all this increased wildfire activity is due to climate change. An educated guess is about half, experts say. Its role, however, is growing fast. Within 20 years, climate change promises to be the dominant factor driving larger and more frequent megafires — not only in California, but across the country.

Tags: , , ,

Tracking what happens to police after use of force on protestors

You’ve probably seen the videos. ProPublica is tracking to see what happens after:

ProPublica wanted to find out what happens after these moments are caught on tape. We culled hundreds of videos to find those with the clearest examples of officers apparently using a disproportionate level of force against protesters and reached out to 40 law enforcement agencies about the 68 incidents below. For each incident, we inquired about any disciplinary action, investigations and whether the department would disclose the officer or officers involved. While some departments provided details or relevant public records, others leaned on state laws to withhold information.

See also ProPublica’s recent release of NYPD civilian complaints against police officers.

Tags: , , ,

Understanding Covid-19 statistics

For ProPublica, Caroline Chen, with graphics by Ash Ngu, provides a guide on how to understand Covid-19 statistics. The guide offers advice on interpreting daily changes, spotting patterns over longer time frames, and finding trusted sources.

Most importantly:

Even if the data is imperfect, when you zoom out enough, you can see the following trends pretty clearly. Since the middle of June, daily cases and hospitalizations have been rising in tandem. Since the beginning of July, daily deaths have also stopped falling (remember, they lag cases) and reversed course.

I fear that our eyes have glazed over with so many numbers being thrown around, that we’ve forgotten this: Every day, hundreds of Americans are dying from COVID-19. Some days, the number of recorded deaths has reached more than 1,000. Yes, the number recorded every day is not absolutely precise — that’s impossible — but the order of magnitude can’t be lost on us. It’s hundreds a day.

Cherrypicking statistics is at an all-time high. Don’t fall for it.

Tags: , , ,