Clock shows percentage of life lived so far

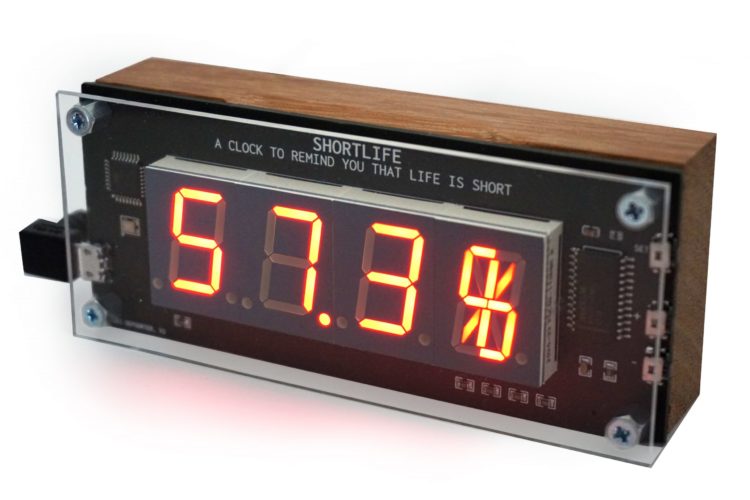
Shortlife is a clock by artist Dries Depoorter that simply shows the percentage of your life lived, based on life expectancy from the World Health Organization. It has a warranty of six months.

I kind of want this? Please note: Results may vary.

Tags: , ,

Increased maternal death in the United States

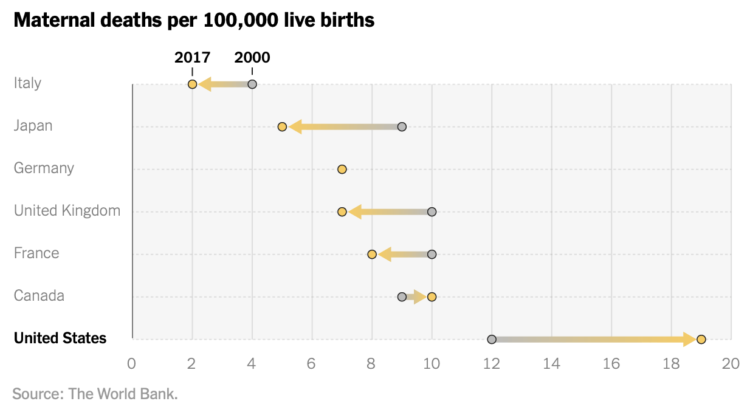
While still relatively rare, maternal mortality in the United States increased over the years. In most other developed countries, rates decreased over the same time period. From NYT Opinion:

Over the past two decades, maternal mortality has increased almost 60 percent. The United States is the only other Group of 7 country besides Canada to experience such a drastic decline in maternal health. (Canada saw a minor increase in pregnancy-related deaths.)

Tags: , ,

Americans are dying too much

Derek Thompson for The Atlantic highlights recent research comparing mortality in America against rates in Europe:

According to a new working paper released by the National Bureau of Economic Research, Americans now die earlier than their European counterparts, no matter what age you’re looking at. Compared with Europeans, American babies are more likely to die before they turn 5, American teens are more likely to die before they turn 20, and American adults are more likely to die before they turn 65. At every age, living in the United States carries a higher risk of mortality. This is America’s unsung death penalty, and it adds up. Average life expectancy surged above 80 years old in just about every Western European country in the 2010s, including Portugal, Spain, France, Italy, Germany, the U.K., Denmark, and Switzerland. In the U.S., by contrast, the average life span has never exceeded 79—and now it’s just taken a historic tumble.

Find the full NBER paper here.

Tags: , ,

Black mortality gap

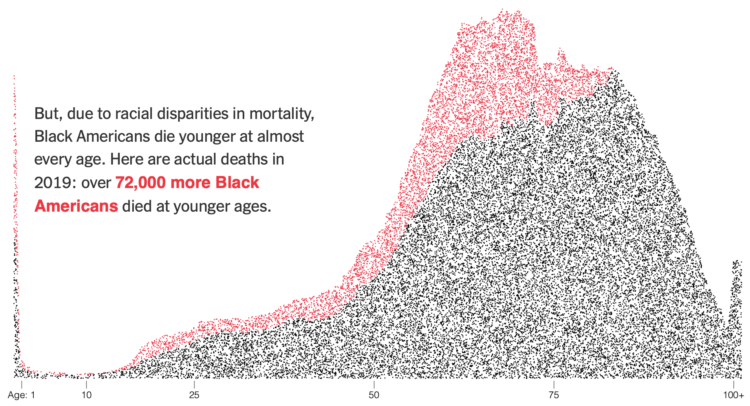
Anna Flagg, for NYT’s The Upshot, used dots arranged as a stacked area chart to show the difference between two mortality rates. Each dot represents 10 people, and they start as a random cloud. A transition to show rate by age lends focus to both an absolute and relative count.

Tags: , , ,

Dot density to show Covid-19 deaths over time

The United States passed 425,000 coronavirus deaths this week. For The New York Times, Lazaro Gamio and Lauren Leatherby used dot density over time to show how we got to this point.

Each dark pixel represents a death, and each tick mark represents a day. So the strip starts light with sparsely placed dots, and then it gets darker and darker. Get to present day, and there’s hardly any white space.

Tags: , ,

Lifelines

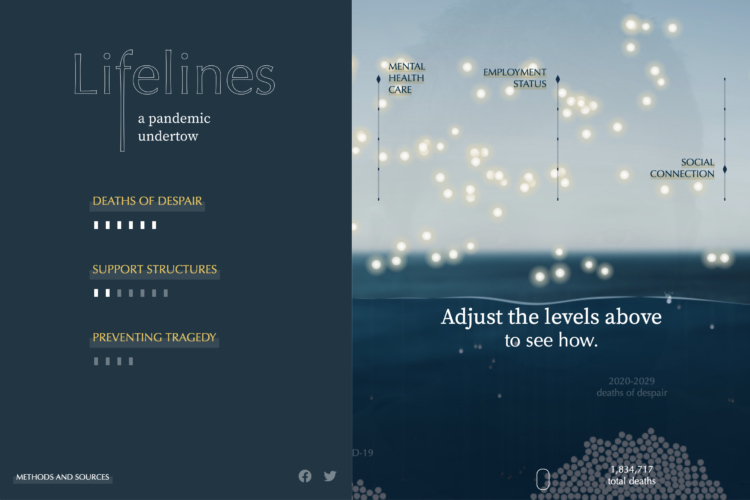
Using estimates from a report by the Well Being Trust and the Robert Graham Center, Periscopic shows projected deaths of despair in Lifelines.

Lights, each representing a life, float above the water, and as you adjust levels of mental health care, employment, and social connection, the lives either sink to the bottom or stay above the water. How do we keep as many as we can above water?

Tags: , ,

Covid-19, the third leading cause of death

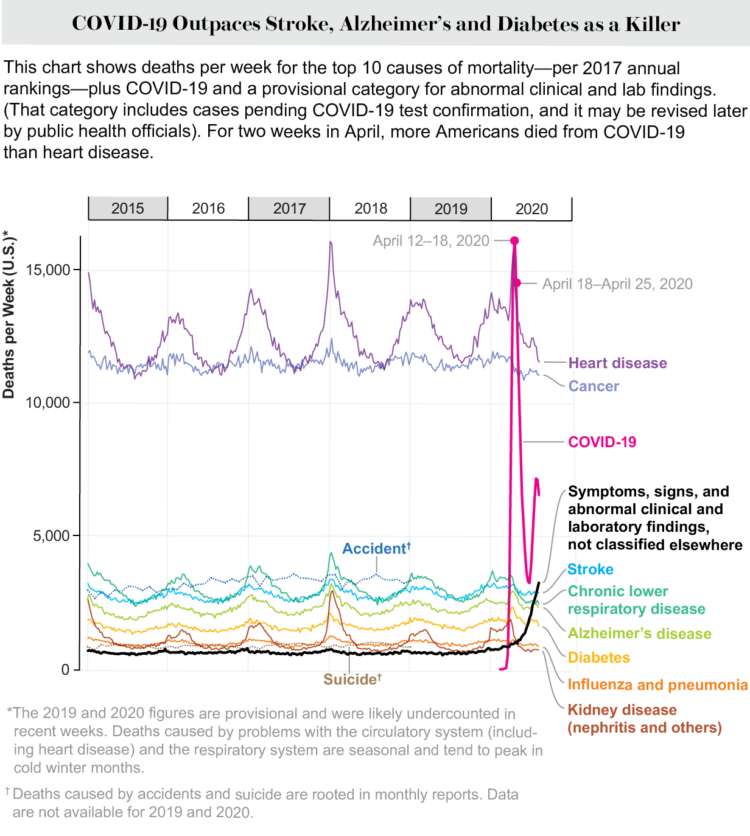
For Scientific American, Youyou Zhou made a line chart that shows cause of death in the United States, from 2015 up to present. Covid-19 was the leading cause of death in April and is now sitting at number 3. The rise in unclassified deaths also stands out.

Tags: , ,

Gaps between mortality rates for black and white Americans

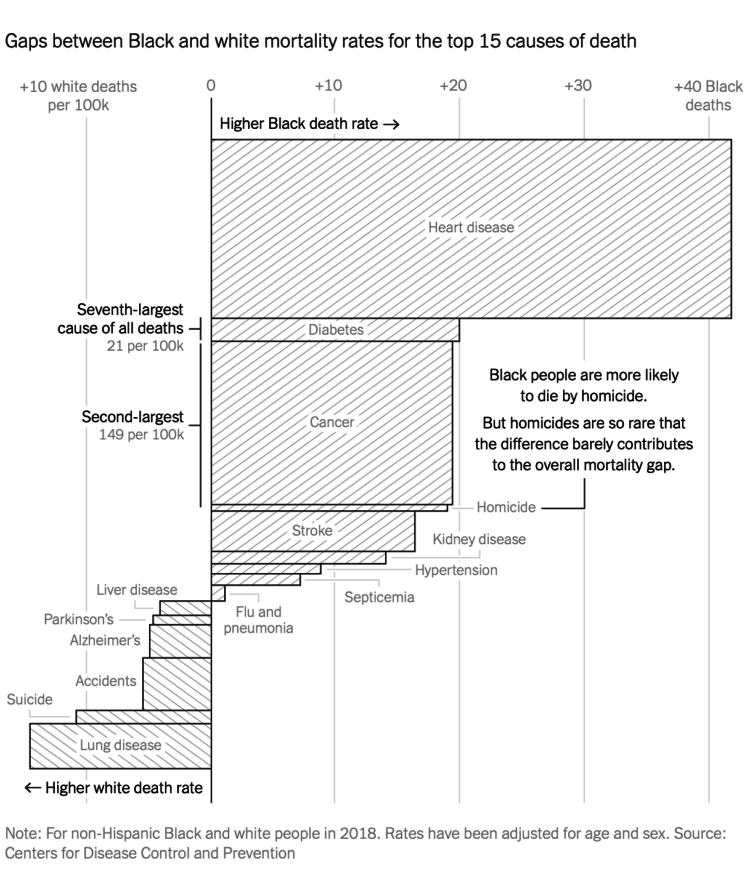
For NYT Opinion, Gus Wezerek charted the gaps between white and black mortality rate:

If Black people had died at the same age-adjusted rate as white people in 2018, they would have avoided 65,000 premature, excess deaths — the equivalent of three coach buses filled with Black people crashing and killing them all every day of the year.

…oof.

The variable width bar chart above is one of several graphics in the piece. Height represents rate. Width represents the gap. Direction represents which group has the higher rate.

Tags: , , , ,

Comparing the coronavirus to past deadly events

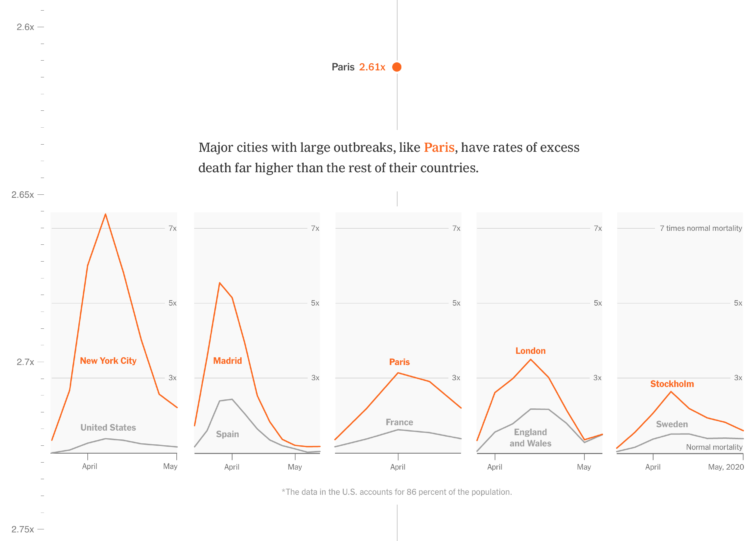
One way to estimate the impact of the coronavirus is to compare it against expected mortality. People are still dying of other causes. The virus has increased the total counts around the world. The New York Times compared these increases against other deadly events:

Only the worst disasters completely upend normal patterns of death, overshadowing, if only briefly, everyday causes like cancer, heart disease and car accidents. Here’s how the devastation brought by the pandemic in 25 cities and regions compares with historical events.

The result is a vertical scroll that starts at a normal mortality rate and takes you through increasingly deadlier events like the HIV/AIDS crisis, Hurricane Katrina, and eventually up to the Spanish Flu outbreak. You see how the coronavirus increased deaths in major cities along the way.

When you couple these events with memories of how we reacted, the current state of affairs is tough to comprehend.

Tags: , ,

Possible coronavirus deaths compared against other causes

Based on estimates from public health researcher James Lawler, The Upshot shows the range of coronavirus deaths, given variable infection and fatality rate. Adjust with the sliders and see how the death count (over a year) compares against other major causes of death:

Dr. Lawler’s estimate, 480,000 deaths, is higher than the number who die in a year from dementia, emphysema, stroke or diabetes. There are only two causes of death that kill more Americans: cancer, which kills just under 600,000 in a year, and heart disease, which kills around 650,000.

A coronavirus death toll near the top of the C.D.C. range (1.7 million) would mean more deaths from the disease than the number of Americans typically killed by cancer and heart disease put together.

Can we all agree now that brushing off coronavirus by floating annual flu numbers is a bad comparison? The most worrisome part of the data we have is the uncertainty and then the range of possibilities that come out of that uncertainty.

Tags: , , ,