Psuedo-charts with Microsoft Image Creator

With each new AI-based tool that comes out, I begrudgingly kick the tires to see what kind of charts it spits out. I need to know when it’s time to hang the old data boots and switch careers. My most recent test subject: Microsoft Image Creator, which is powered by the text-to-image model DALL-E 3. These are “beautiful” charts through the lens of the model.

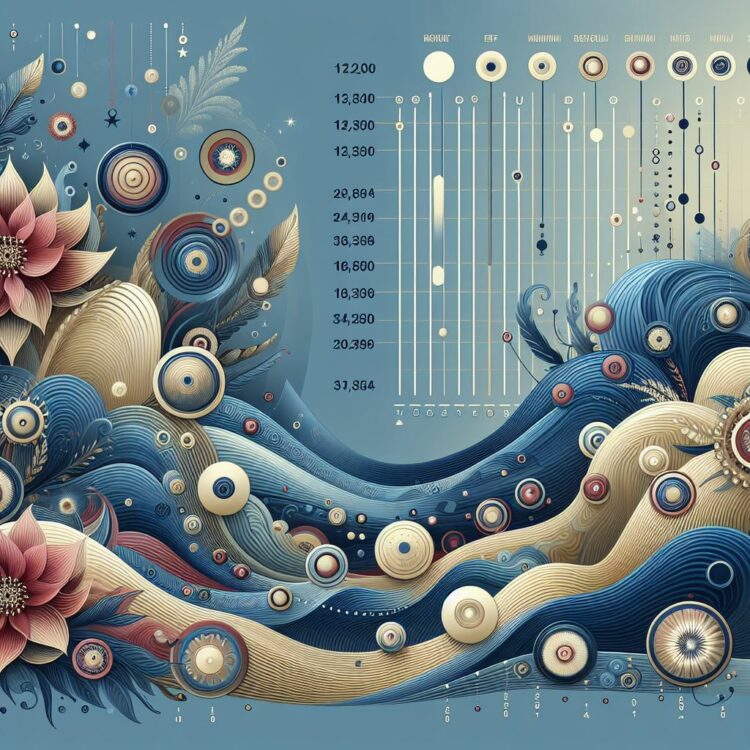
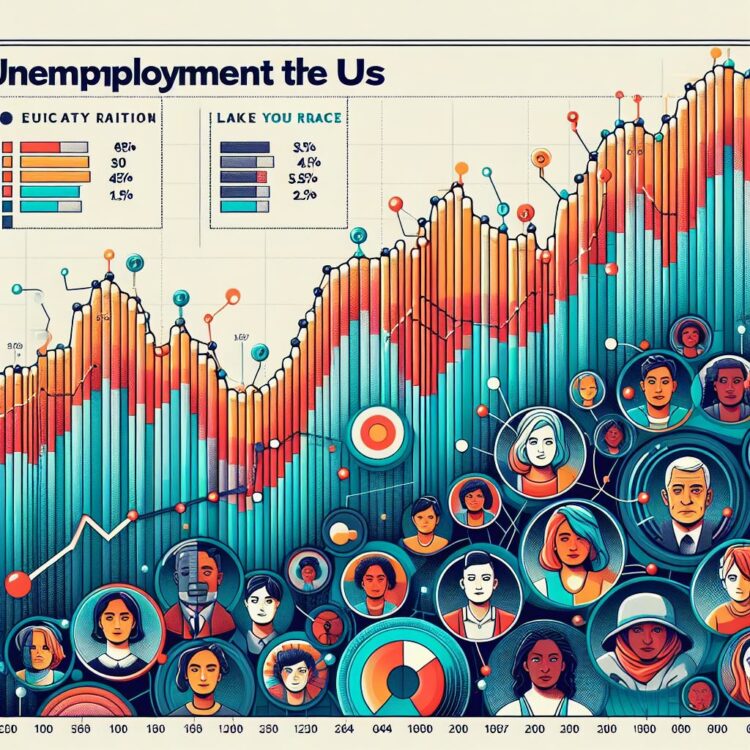
These are fine, I guess. Obviously they don’t show any real data yet. Maybe my queries need to be more specific, but these mostly feel like charts that were made to accommodate every data choice and angle instead of narrowing down to something useful.

Tags: , ,

Charting software that pre-dates Excel

RJ Andrews digs up the PC archives of charting software. Scrolling through the thread, you can see the roots of Excel in the software that pre-dates the 1987 Windows release, along with what was considered nice back in the day. In many ways, such as in the interface, features, and chart types, things haven’t changed that much over the past few decades.

Tags: , ,

Working the triple peak

Microsoft researchers analyzed keystrokes by time of day, for a sample of Microsoft employees during this past summer. You can see the typical peaks during work hours with a dip for lunch. But among 30% of workers in the sample, there was a third peak starting around 9 o’clock in the evening.

That third peak felt too close to home for me.

Tags: , ,

Microsoft’s visual data explorer SandDance open sourced

Microsoft just open sourced their data exploration tool known as SandDance:

For those unfamiliar with SandDance, it was introduced nearly four years ago as a system for exploring and presenting data using “unit visualizations.” Instead of aggregating data and showing the resulting sums as bar charts, SandDance shows every single row of a dataset (for datasets up to ~500K rows). It represents each of these rows as a mark that can be colored and organized into different areas on the screen. Thus, bar charts are made of their constituent units, stacked, or sorted.

Nice. I hadn’t heard about SandDance until now, but I’m saving for later. You can grab the source on GitHub.

Tags: , ,

All the building footprints in the United States

Microsoft released a comprehensive dataset for computer-generated building footprints in the United States. The method:

We developed a method that approximates the prediction pixels into polygons making decisions based on the whole prediction feature space. This is very different from standard approaches, e.g. Douglas-Pecker algorithm, which are greedy in nature. The method tries to impose some of a priory building properties, which are, at the moment, manually defined and automatically tuned.

The GeoJSON files for each state are available for download, released under the Open Data Commons Open Database License. Nice.

Tags: ,