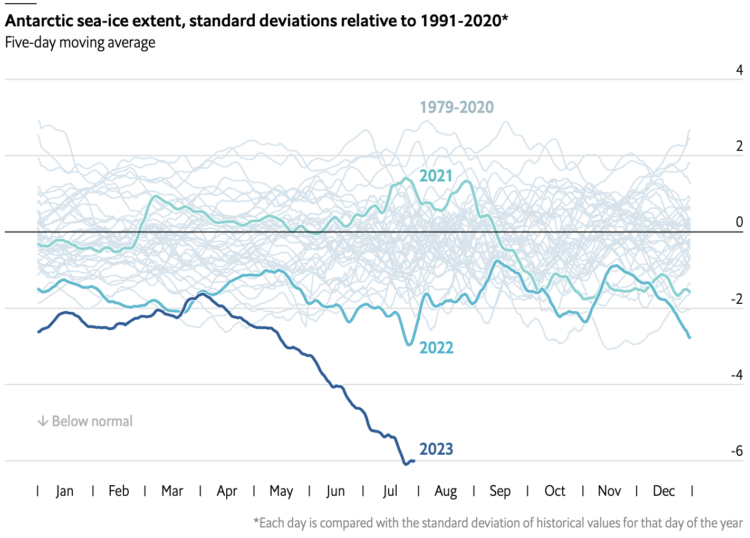
In this chart from The Economist that shows ice extent from 1972 up to present, that falling line for 2023 looks not good.
Tags: Antarctic, Economist, global warming, ice
Adam's Blogroll: click through to the author's blog
In this chart from The Economist that shows ice extent from 1972 up to present, that falling line for 2023 looks not good.
Tags: Antarctic, Economist, global warming, ice
Posted by in Antarctic, Economist, global warming, ice, Statistical Visualization
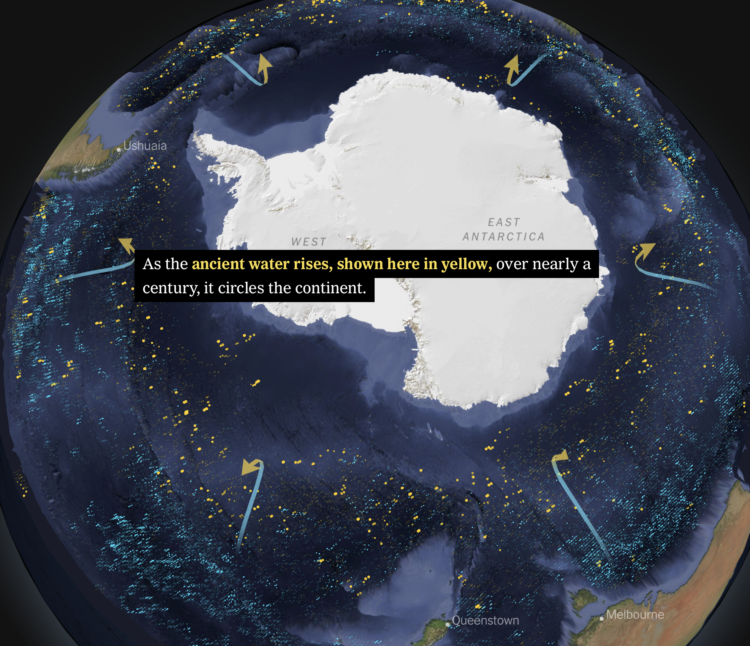
Based on data from autonomous sensors floating in the oceans, researchers are able to model the flows and characteristics of ocean currents in more detail than ever before. For The New York Times, Henry Fountain and Jeremy White show how the shifts have unwelled centuries-old water deep in the ocean, which releases carbon into the air.
The scrollytelling format of this piece works well to show sensor estimates over time. You get a sense of the currents without needing to see animated lines.
Tags: Antarctic, climate change, ice, New York, scrollytelling, water
Posted by in Antarctic, climate change, ice, maps, New York, scrollytelling, water
One way to gauge the amount of ice in the Arctic is to look at the average age of the ice. From the NASA Scientific Visualization Studio, the map above shows the estimated age of ice on a monthly basis, going back to 1984:
One significant change in the Arctic region in recent years has been the rapid decline in perennial sea ice. Perennial sea ice, also known as multi-year ice, is the portion of the sea ice that survives the summer melt season. Perennial ice may have a life-span of nine years or more and represents the thickest component of the sea ice; perennial ice can grow up to four meters thick. By contrast, first year ice that grows during a single winter is generally at most two meters thick.
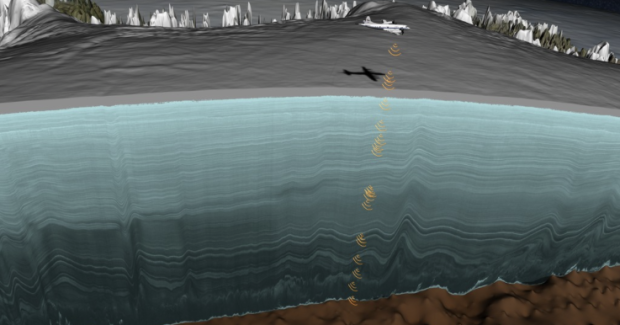
I don't know exactly how much data NASA has in the bank, but I think it's a lot. Explained in the video below, they estimated the age of ice layers in Greenland by flying a plane over the Greenland Ice Sheet and pulsing radar to gather information.