By keeping gas pipelines within the state, companies can avoid federal regulations. This is perhaps good for profits, but it is less of a positive for consumers when the energy companies can increase rates more freely. For Bloomberg, Rachel Adams-Heard, Naureen Malik, and Jeremy C.F. Lin have the maps and charts to show what this means in Texas, which has the most intrastate pipeline in the country.
Tag Archives: energy
When you cross hyrdopower and a battery
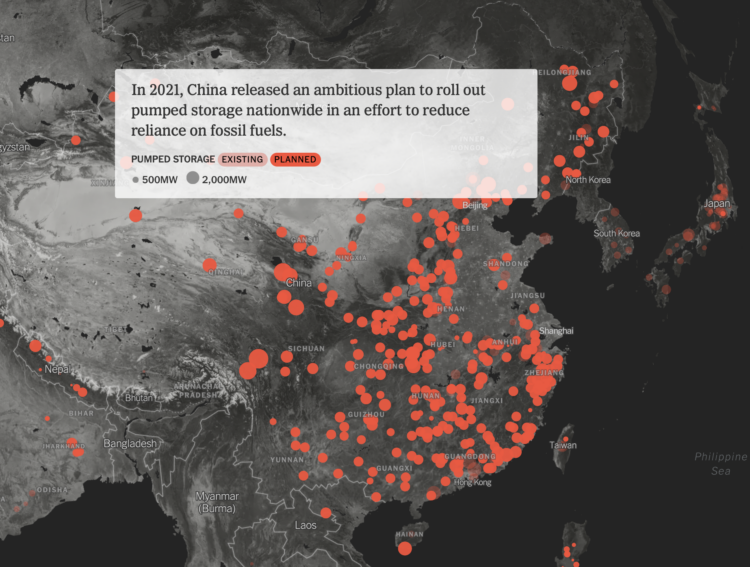
Mira Rojanasakul and Max Bearak for The New York Times highlight the rise of pumped storage around the world. Instead of a big dam to store water, two reservoirs are used. One is high. The other is low. When there is excess power available, water is pumped to the higher one, and when more is needed, water is released down to the lower one.
Tags: energy, New York Times, renewable
Posted by in energy, maps, New York Times, renewable
Retrofitting old British homes to improve energy efficiency
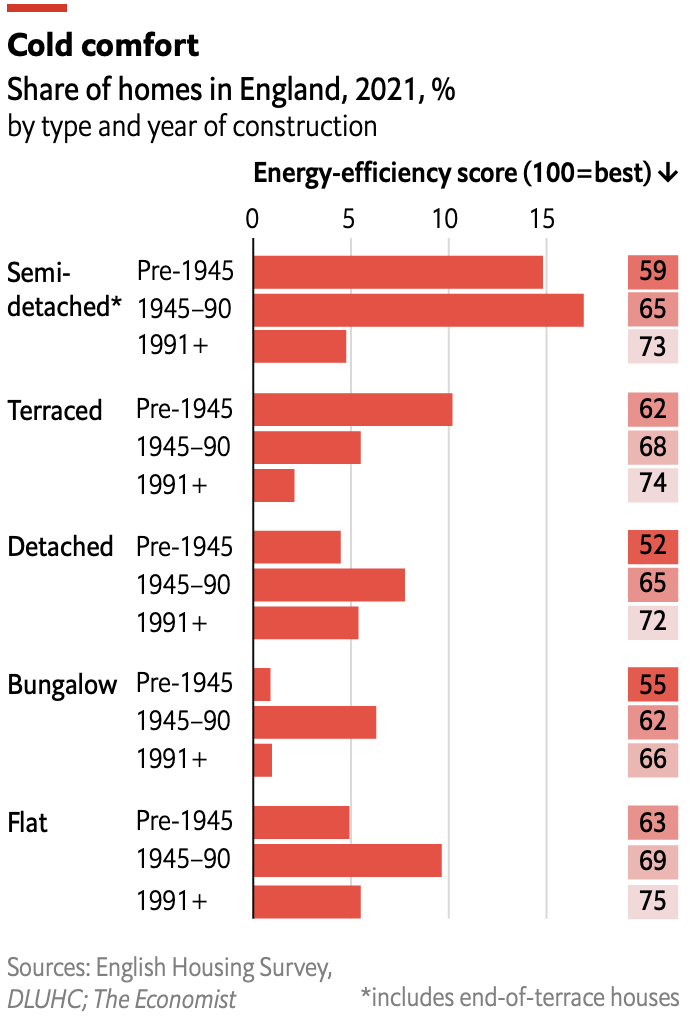 Speaking of old homes and energy efficiency in the UK, The Economist describes renovations that can help reduce energy usage, which is of heightened interest to the British government because it’s footing £40bn of citizens’ energy bills.
They include this small chart on energy efficiency by type of home and when it was built. It took me a second to separate the numbers on the right from the bars on the left, but I eventually got there. The Economist’s self-imposed space constraints for their charts must be fun to think about.
Tags: Britain, energy, renovation, temperature
Posted by in britain, energy, renovation, Statistical Visualization, temperature
Shifts in European energy sources
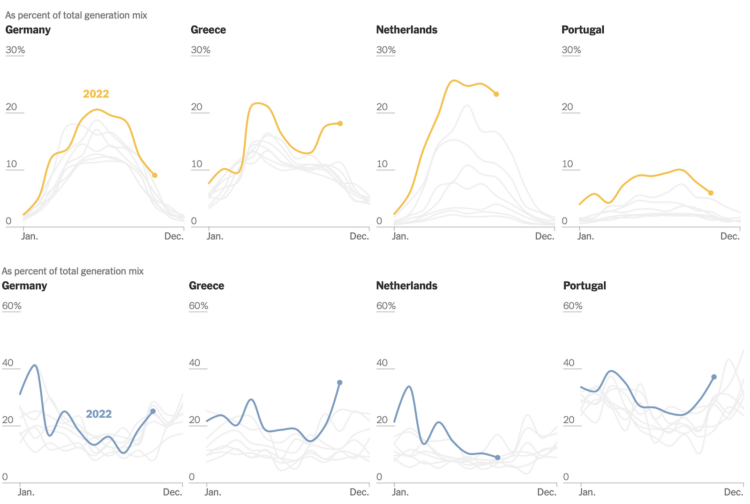
Mira Rojanasakul, for The New York Times, dug into current and historical energy sources in Europe. With the war in Ukraine, Russia cut off natural gas supplies to other countries, but based on estimates from Ember, it looks like the biggest shifts recently are in other energy categories.
Monthly line charts are used for each country and energy source. Lines for previous years rest in the background in a light gray to serve as a point of comparison, whereas the lines for 2022 sit in the front with a bolder color and thicker width to indicate the point of interest.
Tags: energy, Europe, New York Times
Posted by in energy, Europe, New York Times, Statistical Visualization
Where wind and solar needs to grow by 2050
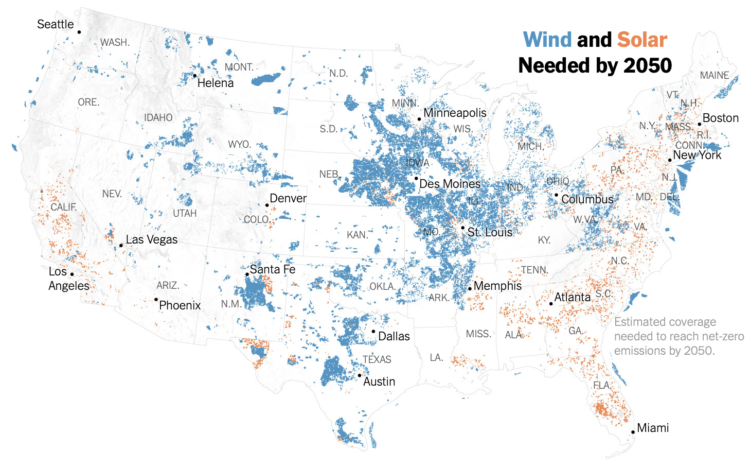
Based on estimates from Princeton University’s Net-Zero America Project, Veronica Penney for The New York Times mapped where wind and solar energy need to expand to to reach the United States’ 2050 goals. Compared to what we need, there is a long way to go from where we are now.
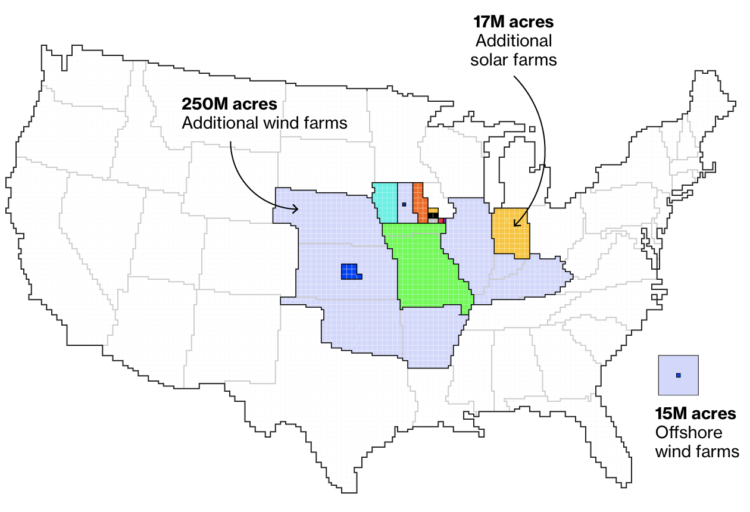
See also Bloomberg’s angle, which used the same data but focused more on land area than on location.
Tags: energy, New York Times, Veronica Penney
Posted by in energy, maps, New York Times, Veronica Penney
Maps of land required to get to net-zero emissions
Princeton University’s Net-Zero America project analyzes and models the infrastructure required to get to net-zero carbon emissions nationally. Dave Merrill for Bloomberg highlighted the group’s estimates for land usage to build things like wind and solar farms, which, as you might imagine, will require millions of acres.
Tags: Bloomberg, carbon, Dave Merrill, energy, land
Getting to zero coal in Britain
For The Guardian, Niko Kommenda shows the decrease in coal usage for power since 2012. As of this writing, it’s been just under 11 straight days with 0% of power generated by burning coal.
The data comes from Gridwatch, which in turn scrapes reports using the Balancing Mechanism Reporting Service from Elexon. Is there a US equivalent?
Posted by in coal, energy, Guardian, Statistical Visualization
Oil and gas wells in the United States
Tim Meko and Laris Karklis for The Washington Post take a dive into oil and gas wells in the United States.
Since 2010, the United States has been in an oil-and-gas boom. In 2015, domestic production was at near-record levels, and we now produce more petroleum products than any other country in the world. President Trump said he plans to double down on the oil and gas industry, lifting regulations and drilling on federal land. Here is the state of the petroleum extraction industry that the new administration will inherit.
Tags: energy, Washington Post
Posted by in energy, maps, Washington Post
A year of home energy usage, by the hour
Michael VanDaniker found that his energy provider, Baltimore Gas and Electric, provides customers with an easy-to-use tool to export their home’s energy usage by the hour. So he downloaded the CSV and had a look back at 2015, through the eyes of heating and cooling. Fun.
By the way, is this data availability a normal thing these days? I was surprised that BGE provided an export tool, but then I checked my energy provider PG&E, and they have one too.
Don’t follow their instructions though, in case you’re interested. After you log in, select Save Energy & Money from the menu, then Your Usage & Tools. But instead of clicking on The Green Button like the directions say, select Usage Analysis, and then click on the green button in the bottom right to download.
Apparently you can get a real-time monitor too. How am I just finding out about this now? Is there a water usage thing yet? There should be a water usage thing.
Tags: energy
Posted by in energy, Self-surveillance
