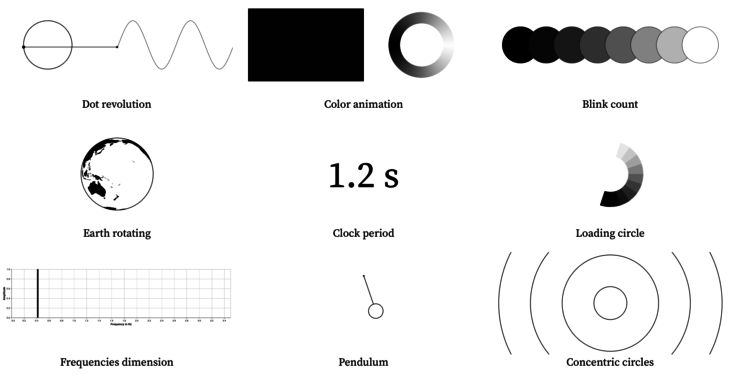
Visualizing periodicity with animations

Pierre Ripoll provides several ways to visualize periodicity using animation. Moving dots, rotating spheres, concentric circles, oh my. He uses D3.js and it’s an Observable notebook, so you can see what’s going on under the hood.

Tags: , , ,

Break the chain

For The Spinoff, Toby Morris illustrates how individuals can break a chain of events:

The good news is, we can do things that will reduce the chances of us spreading the virus. That means we can break these chains and potentially stop hundreds or even thousands of people getting Covid-19. Check out The Spinoff cartoonist Toby Morris’ excellent illustration to understand how individual discipline can have an outsize impact.

Of course infection between people in a community is more complex. Just because one chain is broken doesn’t mean people further down won’t be infected by others in some other way. The goal though is to break as many chains as possible.

Tags: , , ,

SVG and CSS animations, without JavaScript

Andrew Wang-Hoyer built over 200 animations on and off over two years. They are satisfyingly hypnotic. They also only use SVG, CSS, and HTML, and you can get the code on GitHub.

I feel like sans-JavaScript is becoming a thing. Is this becoming a thing?

Tags: , ,

Printing money at the speed of various wages

Neal Agarwal used a money printing metaphor to depict differences in various wages. The higher the wage, the faster the money prints. Keep scrolling and you also see big company revenues, finished with a frantic U.S. deficit increase.

So good. [Thanks, Neal]

Tags: , ,

Mapping the construction of railroads in America

For the Financial Times, Alan Smith and Steven Bernard traced the history of railroad construction in America and mapped it over time. Literally. Bernard used digitized versions of old maps and traced each new segment by hand. Tedious, but the result is impressive.

Tags: , ,

Natural selection simulation

Using blobbies with varying traits such as size, speed, and food gathering ability, Primer simulates natural selection in the explainer video below. Blobby.

Tags: , ,

Animation in visualization, revisited a decade later

Rewind to 2006 when Hans Rosling’s talk using moving bubbles was at peak attention. Researchers studied whether animation in visualization was a good thing. Danyel Fisher revisits their research a decade later.

While they found that readers didn’t get much more accuracy from the movement versus other method, there was a big but:

But we also found that users really liked the animation view: Study participants described it as “fun”, “exciting”, and even “emotionally touching.” At the same time, though, some participants found it confusing: “the dots flew everywhere.”

This is a dilemma. Do we make users happy, or do we help them be effective? After the novelty effect wears off, will we all wake up with an animation hangover and just want our graphs to stay still so we can read them?

Tags: ,

Understanding animated transitions in data visualization

Alec Barrett for TWO-N describes the benefits and some of the intricacies of animated transitions in data visualization.

This visual essay is inspired by the question: What is happening conceptually between the start and end of a transition? I look at reasons for using animated transitions (besides “it looks cool”) and at the kinds of variables that can be transitioned. I conclude that we can think of animated transitions in two categories: those where the space between the start and end states consists of real/realistic data and grammatically valid states for that visualization, and those where it does not.

The essay by the way was published on Observable, a new-ish way to publish “interactive notebooks for data analysis, visualization, and exploration.” Worth a look if you’re into publishing and sharing code.

Tags: ,

3-D tube chart of global CO2 concentration and temperature

Because you can never have enough time series charts that show increases of CO2 and temperature over decades. By Kevin Pluck:

Differing from the variations we’ve seen before, time is on the circle, and the metrics are on the vertical. Then it rotates for dramatic effect.

See also the the two-dimensional Cartesian version from Bloomberg and the polar coordinate version by Ed Hawkins. There are also plenty more temperature charts. I think after this, we’re set for a while.

Tags: , ,

Breathing Earth of vegetation

Using data from NOAA STAR, Nadieh Bremer creates a breathing Earth that shows the seasonal cycles of vegetation over the course of a year.

The animation happening in the map above, through all 52 weeks of 2016, visualizes these seasonal cycles. The rise and fall of the growing season in the Northern Hemisphere is particularly visible. However, when focusing on different parts of the planet other cycles & different seasons become noticeable as well; the Southern regions of Africa, Brazil, and New Zealand, having the reverse cycle as the North, or India getting drier and drier up until the July when the monsoons start. The more often you watch the year go by, the more small details will start to stand out.

See also John Nelson’s project from a while back of the same name, which made use of satellite imagery.

Tags: , ,