Scale of one million deaths

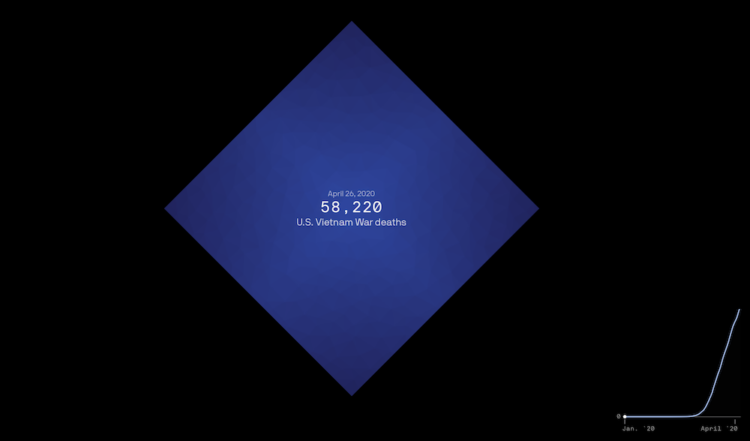
The United States is about to reach one million confirmed Covid deaths, or already passed the mark if you consider excess deaths. There’s no way to truly feel that number, but Axios visualized the scale, with comparisons against city populations and historical events.

A diamond shape represents counts, and as you scroll, shapes fill the screen until you only see the tips. The shapes overflow beyond what we can or want to understand. The time series line on the bottom shows cumulative deaths over time, leading towards the one-million mark.

Tags: , , ,

Increasing mortality baseline

There was a time not that long ago when a hundred covid deaths seemed like a lot, but now the United States is getting closer to one million deaths with over a thousand deaths per day. The country is unmasking and re-opening. For The Atlantic, Ed Yong discusses the shifting baseline and our perception of these big numbers:

The United States reported more deaths from COVID-19 last Friday than deaths from Hurricane Katrina, more on any two recent weekdays than deaths during the 9/11 terrorist attacks, more last month than deaths from flu in a bad season, and more in two years than deaths from HIV during the four decades of the AIDS epidemic. At least 953,000 Americans have died from COVID, and the true toll is likely even higher because many deaths went uncounted. COVID is now the third leading cause of death in the U.S., after only heart disease and cancer, which are both catchall terms for many distinct diseases. The sheer scale of the tragedy strains the moral imagination. On May 24, 2020, as the United States passed 100,000 recorded deaths, The New York Times filled its front page with the names of the dead, describing their loss as “incalculable.” Now the nation hurtles toward a milestone of 1 million. What is 10 times incalculable?

Tags: , , ,

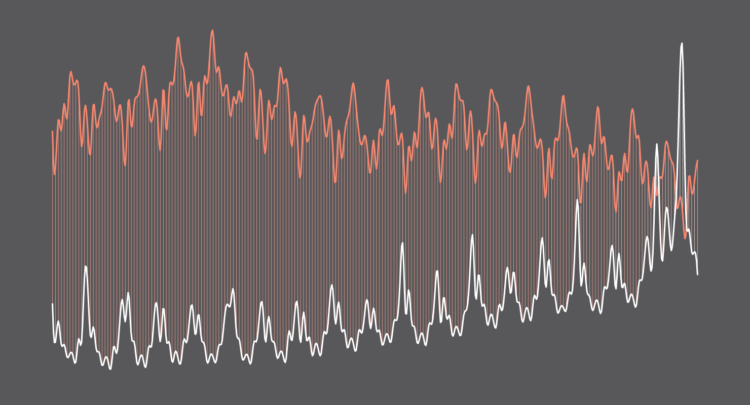
When There Were More Deaths Than Births in the U.S.

The two counts have been getting closer to each other. The past couple of years accelerated the process.

Read More

Death rates by vaccination booster status

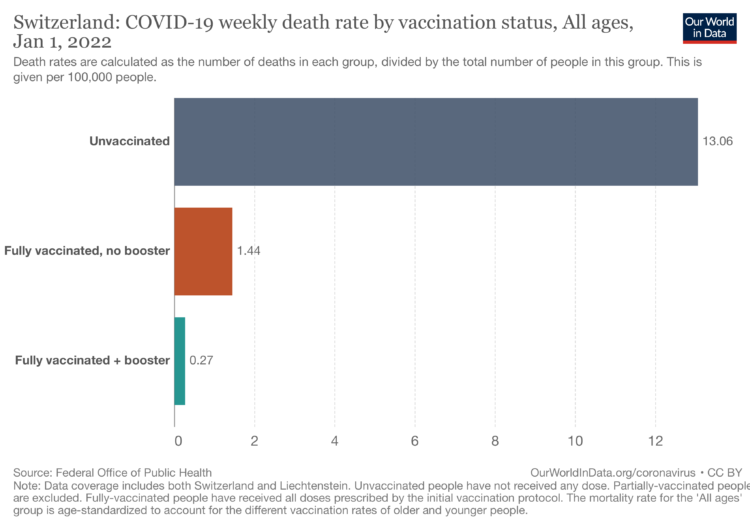
Our World in Data continues their important work on providing and showing up-to-date Covid data. Most recently, they updated death rates in Switzerland by vaccination plus booster status. The rates for the unvaccinated are expectedly much higher, but also the rates for those with a booster are multiples lower than those fully vaccinated with no booster.

Tags: , , ,

Clock shows percentage of life lived so far

Shortlife is a clock by artist Dries Depoorter that simply shows the percentage of your life lived, based on life expectancy from the World Health Organization. It has a warranty of six months.

I kind of want this? Please note: Results may vary.

Tags: , ,

Increased maternal death in the United States

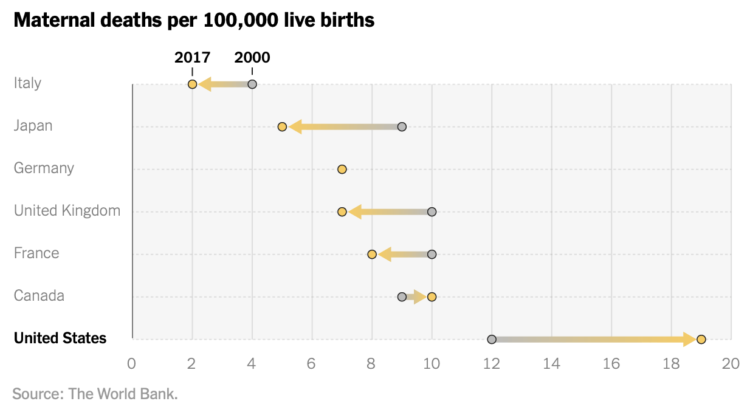
While still relatively rare, maternal mortality in the United States increased over the years. In most other developed countries, rates decreased over the same time period. From NYT Opinion:

Over the past two decades, maternal mortality has increased almost 60 percent. The United States is the only other Group of 7 country besides Canada to experience such a drastic decline in maternal health. (Canada saw a minor increase in pregnancy-related deaths.)

Tags: , ,

Americans are dying too much

Derek Thompson for The Atlantic highlights recent research comparing mortality in America against rates in Europe:

According to a new working paper released by the National Bureau of Economic Research, Americans now die earlier than their European counterparts, no matter what age you’re looking at. Compared with Europeans, American babies are more likely to die before they turn 5, American teens are more likely to die before they turn 20, and American adults are more likely to die before they turn 65. At every age, living in the United States carries a higher risk of mortality. This is America’s unsung death penalty, and it adds up. Average life expectancy surged above 80 years old in just about every Western European country in the 2010s, including Portugal, Spain, France, Italy, Germany, the U.K., Denmark, and Switzerland. In the U.S., by contrast, the average life span has never exceeded 79—and now it’s just taken a historic tumble.

Find the full NBER paper here.

Tags: , ,

Black mortality gap

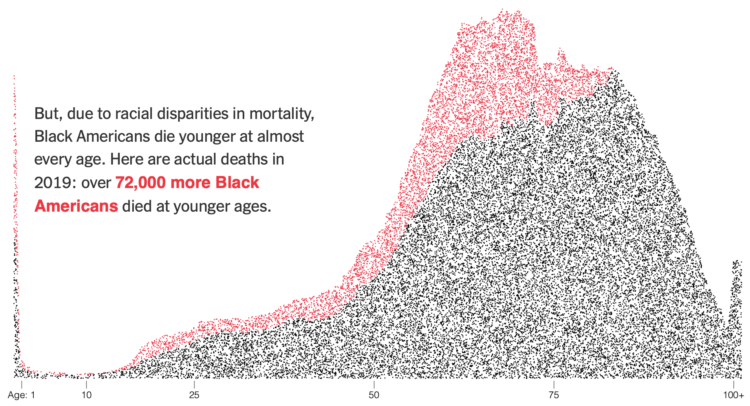
Anna Flagg, for NYT’s The Upshot, used dots arranged as a stacked area chart to show the difference between two mortality rates. Each dot represents 10 people, and they start as a random cloud. A transition to show rate by age lends focus to both an absolute and relative count.

Tags: , , ,

Dot density to show Covid-19 deaths over time

The United States passed 425,000 coronavirus deaths this week. For The New York Times, Lazaro Gamio and Lauren Leatherby used dot density over time to show how we got to this point.

Each dark pixel represents a death, and each tick mark represents a day. So the strip starts light with sparsely placed dots, and then it gets darker and darker. Get to present day, and there’s hardly any white space.

Tags: , ,

Lifelines

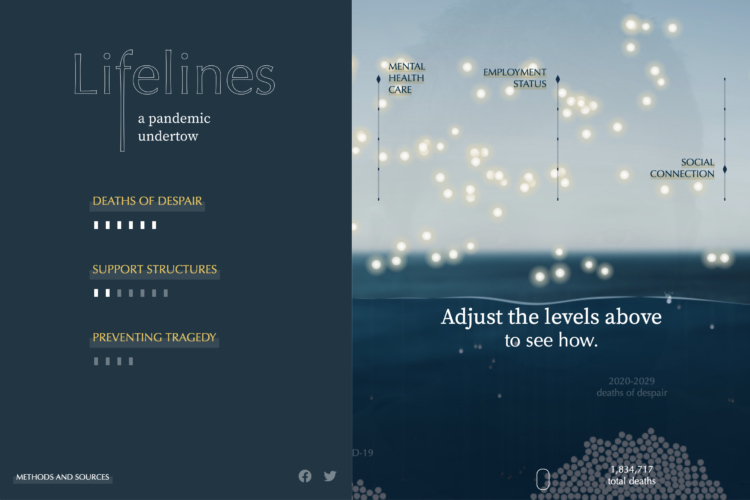
Using estimates from a report by the Well Being Trust and the Robert Graham Center, Periscopic shows projected deaths of despair in Lifelines.

Lights, each representing a life, float above the water, and as you adjust levels of mental health care, employment, and social connection, the lives either sink to the bottom or stay above the water. How do we keep as many as we can above water?

Tags: , ,