✚ Letting the Data Play Through

A good chart shows patterns that you otherwise wouldn’t see in a spreadsheet. To some, this means showing all the data at once so that you can see a full trend efficiently, but there are benefits to showing a little bit at a time.

Become a member for access to this — plus tutorials, courses, and guides.

✚ Play With Your Data

Welcome to issue #204 of The Process, the newsletter for FlowingData members that looks closer at how the charts get made. I’m Nathan Yau, and this week I’m in search of less work and more play, because too much of the former is tiring.

Become a member for access to this — plus tutorials, courses, and guides.
What’s on your “To Do” List?

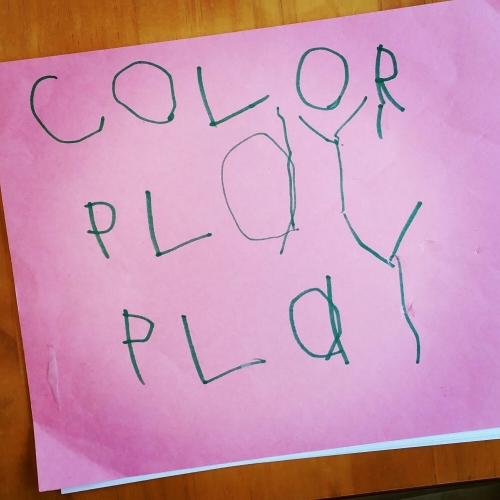
This was my four-year-old’s “To Do” list. I think she gets it.
image

Unfortunately, investing in her life coaching sessions is not cheap*.

*Insert college tuition joke here.


Filed under: Follies of the Human Condition Tagged: Art, parenting, play, to do list