✚ Long Information

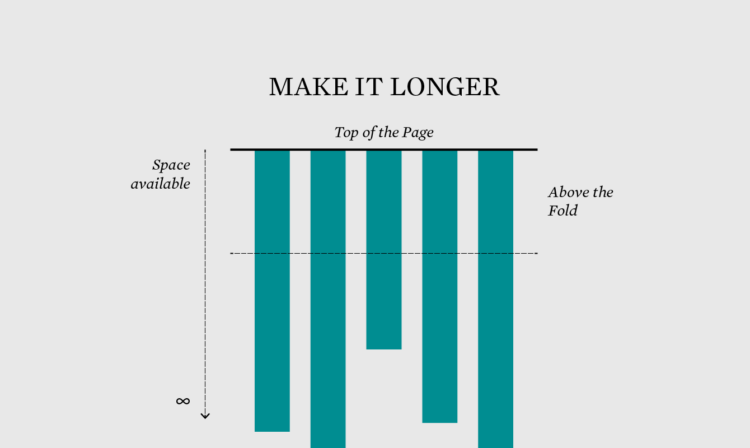
Welcome to The Process, the newsletter for FlowingData members that looks closer at how the charts get made. I’m Nathan Yau. There was a time when big infographics ruled, and then their popularity faded as quickly as it came. It wasn’t because of their size though, which might have been the only thing right about them.

Become a member for access to this — plus tutorials, courses, and guides.

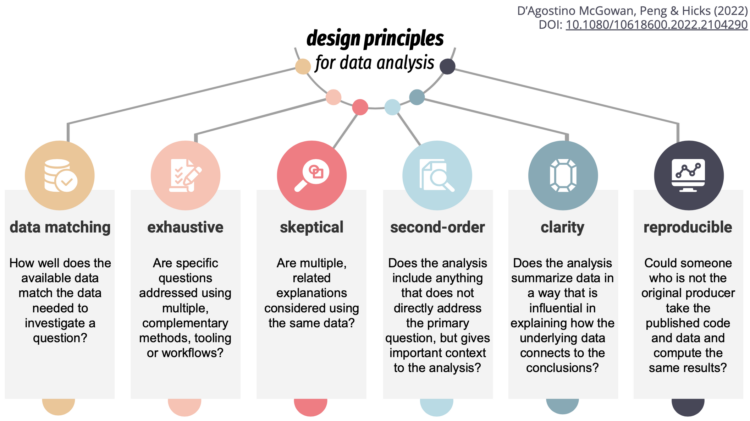
Design principles for data analysis

To teach, learn, and measure the process of analysis more concretely, Lucy D’Agostino McGowan, Roger D. Peng, and Stephanie C. Hicks explain their work in the Journal of Computational and Graphical Statistics:

The design principles for data analysis are qualities or characteristics that are relevant to the analysis and can be observed or measured. Driven by statistical thinking and design thinking, a data analyst can use these principles to guide the choice of which data analytic elements to use, such as code, code comments, data visualization, non-data visualization, narrative text, summary statistics, tables, and statistical models or computational algorithms (Breiman 2001), to build a data analysis. Briefly, the elements of an analysis are the individual basic components of the analysis that, when assembled together by the analyst, make up the entire analysis.

Tags: ,

✚ Analytical Stand-in – The Process 146

Welcome to issue #146 of The Process, the newsletter for FlowingData members about how the charts get made. I’m Nathan Yau, and this week I’m thinking about one of my least favorite types of visualization: the chart meant for analysis standing in for a chart meant for presentation.

Become a member for access to this — plus tutorials, courses, and guides.

✚ Analysis as Detective Work (The Process #62)

Analysis and visualization are often a messy process that never matches up to the step-by-step guides you read, but that's normal. Read More

✚ Visualization for Analysis vs. Visualization for an Audience (The Process #59)

The visualizations are used and read differently, which requires that you approach their design differently. Read More

✚ No Data, Chart Dies

If the charts themselves are fairly straightforward without any dubious design choices, are you still "lying with charts" when only the data itself was manipulated? Read More

People relationships in data analysis

Roger Peng discusses the importance of managing the relationships between people — analyst, patron, subject matter expert, and audience — for a successful analysis:

Human relationships are unstable, unpredictable, and inconsistent. Algorithms and statistical tools are predictable and in some cases, optimal. But for whatever reason, we have not yet been able to completely characterize all of the elements that make a successful data analysis in a “machine readable” format. We haven’t developed the “institutions” of data analysis that can operate without needing the involvement of specific individuals. Therefore, because we have not yet figured out a perfect model for human behavior, data analysis will have to be done by humans for just a bit longer.

Whenever someone touts a tool for “automatic insights”, whether it be in analysis or chart generation, something like this comes to mind.

Tags: , ,

Data visualization for analysis and understanding complex problems

Enrico Bertini, a professor at New York University, delves into the less flashy but equally important branch of visualization: analysis. Much of what Enrico describes applies to the other branches too, so it’s worth the full read:

One aspect of data visualization I have been discovering over the years is that when we talk about data visualization we often think that the choice of which graphical representation to use is the most important one to make. However, deciding what to visualize is often equally, if not more, important, than deciding how to visualize it. Take this simple example. Sometime a graph provides better answers to a question when the information is expressed in terms of percentages than absolute values. I think it would be extremely helpful if we could better understand and characterize the role data transformation plays in visualization. My impression is that we tend to overemphasize graphical perception when content is what really makes a difference in many cases.

Getting to that what often requires iteration between the analysis and presentation facets of visualization. I spend about the same time on the analysis side as on presentation, and that’s only because I’m more fluent with my analysis tools. I don’t have to spend a lot of time reading documentation. The amount of production during the analysis phase is definitely much higher.

Tags: , ,

Fallacy of point-and-click analysis

Jeff Leek touches on concerns about point-and-click software to find the insights in your data, magically and with little to no effort.

I understand the sentiment, there is a bunch of data just laying there and there aren't enough people to analyze it expertly. But you wouldn't want me to operate on you using point and click surgery software. You'd want a surgeon who has practiced on real people and knows what to do when she has an artery in her hand. In the same way, I think point and click software allows untrained people to do awful things to big data.

Yep.

Jeffrey Heer shared a similar sentiment a few months ago:

It's an absolute myth that you can send an algorithm over raw data and have insights pop up.

So, as Leek notes, the key is proper training and critical thinking during analysis. Not just clickety clicks.

If there's software that allows a surgeon to do her job more accurately and efficiently, then yeah, I'm all for it. Similarly, point-and-click software for analysis can be great when the person who uses it knows what's happening.

Stuff like this always brings me back to when my future father-in-law met me for the first time. One of his first questions: "What do you study?"

"Statistics."

In a disapproving voice of a skeptical father, protective of his daughter, he replied, "Won't computers do that for you?" As in hi person I just met. Maybe you should consider a different career path and not date my daughter, you loser statistician.

Ah, memories. (He loves me now.)

Tags: ,