Data Visualization in Society

Data Visualization in Society, an open access book, is a collection of works that looks closer at the role data visualization plays beyond the technical aspects of the discipline:

The expansion of data visualization in society therefore requires a new kind of literacy if it is to enable citizens to act in informed and critical ways. It also requires the assessment of data visualization’s role in democracy, and the reassessment of democratic theory in light of developments in data visualization. This means asking a range of questions about the relationship between data visualization and democracy. It also means considering the factors in visualization consumption and production processes that affect engagement, which might include factors which extend beyond textual and technical matters, such as class, gender, race, age, location, political outlook, and education of audience members. Some of the contributions in this collection address these issues.

My reading list just got longer.

The Datavis Book Club run by Datawrapper is reading and discussing the first four chapters, in case you want get in on the fun.

Tags: ,

Comparison of terms and conditions lengths

Most of us don’t read the terms and conditions before we click on “I agree” for the web services we use. They’re too long, and we need likes right away. For a student project, Dima Yarovinsky printed the terms and conditions on paper for major social apps — WhatsApp, Google, Tinder, Twitter, Facebook, Snapchat, and Instagram, respectively — which highlights what we’re getting into. [via @hailmika]

Tags: , , ,

Network Effect overwhelms with data

Network Effect

Network Effect by Jonathan Harris and Greg Hochmuth is a gathering of the emotions, non-emotion, and everyday-ness of life online. It hits you all at once and overwhelms your senses.

We gathered a vast amount of data, which is presented in a classically designed data visualization environment — all real, all impeccably annotated, all scientifically accurate, all “interesting,” and yet all basically absurd. In this way, the project calls into question the current cult of Big Data, which has become a kind of religion for atheists.

Harris and Hocmuth gathered tweets that mentioned 100 behaviors, such as hug, cry, blow, and meditate, and paired them with YouTube videos that correspond. They then employed workers on Amazon's Mechanical Turk to read the tweets aloud and gather data on when behaviors occurred. Tweets are continually collected to collect data on why people perform such behaviors, and Google Ngram provides historical usage context.

It is a lot of things going on at once.

I could go on, but it's better if you experience it for yourself. You're given about seven minutes per day to view, depending on the life expectancy of where you live. The weird thing is that even though it's an overwhelming view into online life, you're left wanting more, which is exactly what the creators were going for.

Tags: , , ,

Finding small villages in big cities

Urban Village

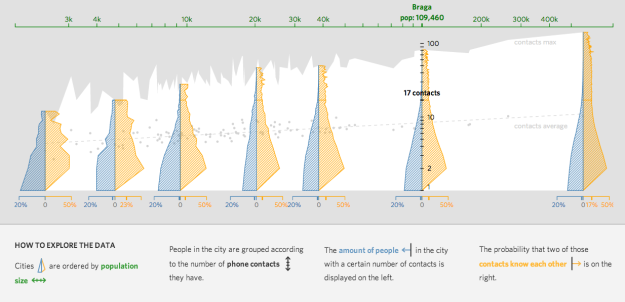
Daily life in cities tends to differ from daily life in small towns, especially by who we interact with. The MIT Senseable City Lab and the Santa Fe Institute studied this social aspect — individuals' contacts by city size — through anonymized mobile phone logs. As expected, those in cities with greater populations tended to have more contacts. However, when the researchers looked at who knew who, the results were more constant.

Surprisingly, however, group clustering (the odds that your friends mutually know one another) does not change with city size. It seems that even in large cities we tend to build tightly knit communities, or 'villages,' around ourselves. There is an important difference, though: if in a real village our connections might simply be defined by proximity, in a large city we can elect a community based on any number of factors, from affinity to interest to sexual preference.

Read the full paper for more details.

Tags: , , ,