Money-in-politics nonprofits merge their datasets

Center for Responsive Politics and National Institute on Money in Politics are merging their datasets to make it more accessible:

The nation’s two leading money-in-politics data organizations have joined forces to help Americans hold their leaders accountable at the federal and state levels, they said today.

The combined organization, OpenSecrets, merges the Center for Responsive Politics (CRP) and the National Institute on Money in Politics (NIMP), each leading entities for three decades. The merger will provide a new one-stop shop for integrated federal, state and local data on campaign finance, lobbying and more, that is both unprecedented and easy to use.

Good. More important than ever.

Tags: , , ,

Data for all of the referee calls in NBA games

Owen Phillips compiled per game and cumulative foul calls for all NBA referees between the 2016-17 and 2019-20 seasons. On its own, I’m not sure it’s that exciting, but if you’re into basketball analytics, it might be fun to tie in with other data.

Tags: , ,

Google search trends dataset for Covid-19 symptoms

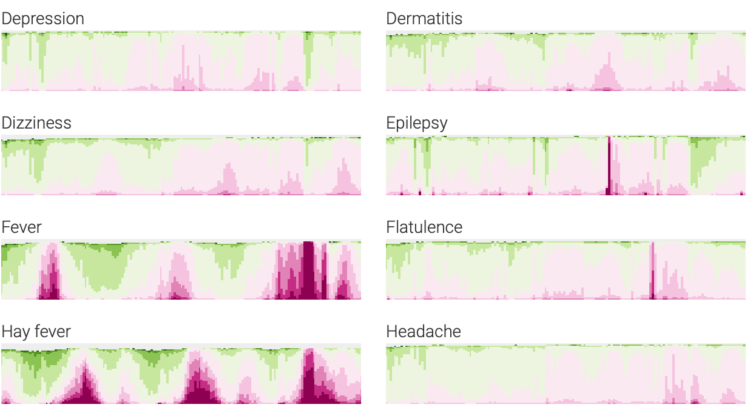
Google released a search trends dataset earlier this month. Using this dataset, Adam Pearce made an explorer to compare search volume over time:

The COVID-19 Search Trends symptoms dataset shows aggregated, anonymized trends in Google searches for more than 400 health symptoms, signs, and conditions, such as cough, fever and difficulty breathing. The dataset provides a time series for each region showing the relative volume of searches for each symptom.

Even if you’re not keen on analyzing Covid-19 data, this is likely a good time series source to at least bookmark for later.

Tags: , , ,

Friends sitcom transcript dataset

For your analytical perusal, Emil Hvitfeldt provides ten seasons’ worth of scripts from the Friends sitcom in an easy-to-use R package:

The goal of friends to provide the complete script transcription of the Friends sitcom. The data originates from the Character Mining repository which includes references to scientific explorations using this data. This package simply provides the data in tibble format instead of json files.

The ten seasons ran from 1994 to 2004. I’m suddenly feeling my age.

Tags: ,

Data on loans issued through the Paycheck Protection Program

The Paycheck Protection Program was established to provide aid to small businesses. It’s a $669-billion loan program. The data for 4.8 million loans, amounting to $521 billion so far, is now available from the Small Business Administration.

For loans less than $150,000, you can download data for all states individually. Data for loans that were more than $150,000 can be downloaded as a single file. Look up business name, type, address, and loan amount range, among several other fields.

Seems like it’s worth a closer look.

Update: The Washington Post made a search interface for the dataset.

Tags: , , ,

What the federal government has been buying and where from

The Federal Procurement Data System tracks federal contracts of $10,000 or more. For ProPublica, Moiz Syed and Derek Willis made the data for coronavirus-related contracts more accessible with a searchable database. Browse the items, the companies, and the amounts. Somehow it seems like so much, and yet so not enough.

See also the accompanying article highlighting some of the more questionable contracts.

Tags: , ,

Coronavirus data at the state and county level, from The New York Times

Comprehensive national data on Covid-19 has been hard to come by through government agencies. The New York Times released their own dataset and will be updating regularly:

The tracking effort grew from a handful of Times correspondents to a large team of journalists that includes experts in data and graphics, staff news assistants and freelance reporters, as well as journalism students from Northwestern University, the University of Missouri and the University of Nebraska-Lincoln. The reporting continues nearly all day and night, seven days a week, across U.S. time zones, to record as many details as possible about every case in real time. The Times is committed to collecting as much data as possible in connection with the outbreak and is collaborating with the University of California, Berkeley, on an effort in that state.

You can download the state- and county-level aggregates on GitHub.

Tags: ,

Restaurant struggles

The restaurant industry is taking a big hit right now, as most people are staying put at home. OpenTable provides a downloadable dataset to show how much restaurant dining is down:

This data shows year-over-year seated diners at restaurants on the OpenTable network across all channels: online reservations, phone reservations, and walk-ins. For year-over-year comparisons by day, we compare to the same day of the week from the same week in the previous year. For example, we’d compare Tuesday of week 11 in 2020 to Tuesday of week 11 in 2019. Only states or cities with 50+ restaurants in the sample are included. All restaurants on the OpenTable network in either period are included.

It’s red all the way down. Support your local businesses the best you can.

Tags: , ,

Nationwide database of credibly accused Catholic clergy

For ProPublica, Ellis Simani and Ken Schwencke compiled an interactive database that you can search:

ProPublica reporters spent months collecting the lists as they were originally released by each diocese. They then made them searchable via a public database in order to provide victims of clerical abuse and members of the public a way to search across all of the released lists.

More than 6,700 names are included in the database, and over 5,800 of them are unique. A little more than half of the people named were listed as being deceased. ProPublica did not have the data necessary to merge records with the same name across dioceses, though our reporting on specific clergy indicates that some have surfaced on as many as eight lists.

Unsettling.

The data is also available for download.

Tags: , , ,