I am a book. I am a portal to the universe.

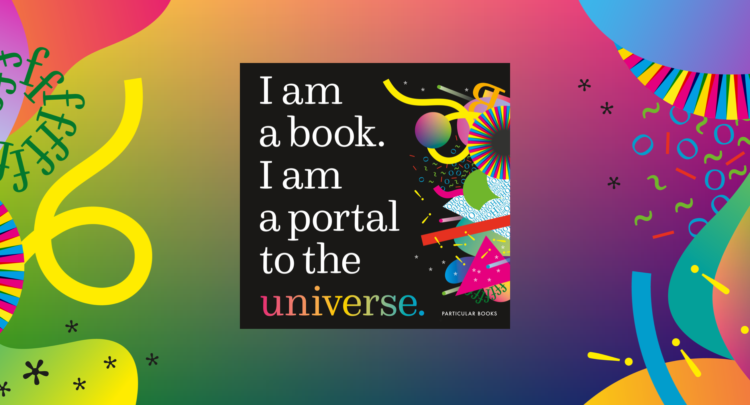
Stefanie Posavec and Miriam Quick have a new book out called I am a book. I am a portal to the universe.

I’m different to any other book around today. I am not a book of infographics. I’m an informative, interactive experience, in which the data can be touched, felt and understood, with every measurement represented on a 1:1 scale. How long is an anteater’s tongue? How tiny is the DNA in your cells? How fast is gold mined? How loud is the sun? And how many stars have been born and exploded in the time you’ve taken to read this sentence?

Using all the elements that make a book, well, a book in a completely original way, I blend playful design and data storytelling to introduce scientific concepts to a broad, all-ages readership.

Instead of using traditional visual encodings, Posavec and Quick use the actual pages of the book — the physical weight, dimensions, and texture — to represent data. You’re invited to drop the book to test gravity, snap the cover shut to hear a measure in decibels, and to run your finger across the pages as a proxy for time and distance.

A fun one for the kids and the adults. I’m sure it’ll make its way over to the US, but it looks like you can get the UK edition in a roundabout way via Amazon. Or, if you’re in Europe, you can go direct to the source.

Tags: , , ,

Climate change displayed, with shower tiles

Based on a chart by Ed Hawkins, the shower wall of Gretchen Goldman and Tom Di Liberto transformed into a canvas to show global warming.

Each row represents a country, and each cell — I mean tile — represents the temperature difference compared to the overall average for the time period.

Tags: , , ,

Faking traffic on Google Maps with a wagon of 99 smartphones

Google Maps incorporates data from smartphones to estimate traffic in any given location. Artist Simon Weckert used this tidbit to throw the statistical models off the scent. With a wagon of 99 smartphones, he turned roads red on Google Maps just by walking around.

Nice.

Tags: , , ,

3-D-Printed Time Series Plates

After seeing a 1950s physical visualization, I wondered if I could follow a similar process using modern techniques. Read More

Visualizations using Play-Doh

We usually visualize data on computers, because it’s where the data exists and it’s a more efficient process. But as long as you can make shapes and use colors, you can use just about any material. Amy Cesal, as part of a 100-day creative project called Day Doh Viz, is using Play-Doh.

Ever since my son shifted his art station to my office, I’ve been drawn to his crayons, markers, and masking tape. The manual labor of it forces a shifted thought process that’s less technical and more about what you want to show. It also feels more like playing. Recommended. [via Visualising Data]

Tags: , ,

Scale model shows how levees increase flooding

Levees are intended to prevent flooding in the areas they are built, but they change the direction and speed of flowing water, which can cause unintended flooding in areas upstream. ProPublica and Reveal collaborated with the St. Anthony Falls Laboratory to build a scale model to show how this can happen.

An interactive graphic lets you shift flow rate up and down to see the changes yourself. The video coupled with the illustration makes the effects super clear.

Tags: , , , ,

Comparison of terms and conditions lengths

Most of us don’t read the terms and conditions before we click on “I agree” for the web services we use. They’re too long, and we need likes right away. For a student project, Dima Yarovinsky printed the terms and conditions on paper for major social apps — WhatsApp, Google, Tinder, Twitter, Facebook, Snapchat, and Instagram, respectively — which highlights what we’re getting into. [via @hailmika]

Tags: , , ,

Regulations.

Doug Mills, reporting for The New York Times:

Echoing his days as a real estate developer with the flair of a groundbreaking, Mr. Trump used an oversize pair of scissors to cut a ribbon his staff had set up in front of two piles of paper, representing government regulations in 1960 (20,000 pages, he said), and today — a pile that was about six feet tall (said to be 185,000 pages).

Interpret as you like.

Tags: ,

Looking for patterns and structures from the sky

Photographer Bernhard Lang takes pictures in small planes and helicopters, pointing his camera towards the ground. In the ongoing project Aerial Views, he focuses on patterns and structures, which makes for interesting visuals that you’d miss on the ground.

Tags: ,

Catching a real ball in virtual reality

Man wears virtual reality headset. Another man throws a ball to headset-wearing man. Headset-wearing man catches actual ball displayed in virtual reality. There’s something magical about the quick data processing going on here.

Tags: , ,