Empty school buses as a representation of student lives lost

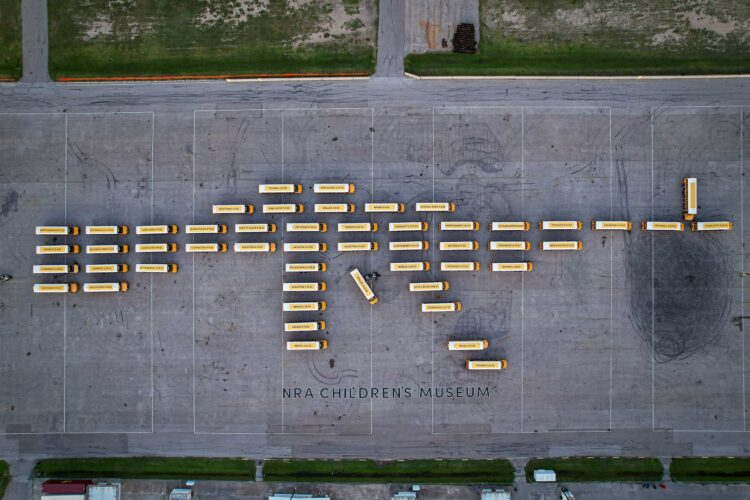
The NRA Children’s Museum from Change the Ref is a mile-long convoy of empty school buses in memory of lives lost to guns:

Since 2020, firearms have overtaken car accidents to become the leading cause of death in children, taking over 4368 lives.

With the advent of this horrific moment, we’ve built a mobile museum made of 52 empty school buses representing 4368 victims. Some of the buses feature an exhibit of artifacts, photos, videos, audio recordings, and personal memories of these children who have lost their lives to guns.

Tags: , ,

Generative sea creatures

Cindermedusae by Marcin Ignac is “a generative encyclopedia of imaginary sea creatures.” I’m into the aesthetic.

Tags: , ,

Chart used as drink label

For Swee Kombucha, Bedow used a stacked chart as a food label to show the ingredient breakdowns for various beverages. The greater the area is, the more ingredient by volume there is in the drink.

This project takes me back. See also nutritional facts redesigned, alcoholic beverage pie charts, the engineer’s guide to drinks, and coffee drink breakdowns. The two-year span from 2010 to 2011 was quite the renaissance period for beverage percentages.

Tags: , ,

Global warming bike path

It amazes me how many places in the world Ed Hawkins’ Warming Stripes appears. My favorite has still gotta be the shower tiles.

Tags: , ,

Clock shows percentage of life lived so far

Shortlife is a clock by artist Dries Depoorter that simply shows the percentage of your life lived, based on life expectancy from the World Health Organization. It has a warranty of six months.

I kind of want this? Please note: Results may vary.

Tags: , ,

AI-powered artwork app

Wombo Dream is a fun app that lets you enter some words to output a related AI-powered artwork in various styles. You can get the app, or you can play with it in your browser. I entered my dissertation title.

Tags: ,

Posted by in AI, Data Art, Wombo

Tags: ,

Permalink

Sonified animation of London Covid-19 rates

Valentina D’Efilippo, Arpad Ray, and Duncan Geere visualized and sonified Covid-19 rates and vaccinations in London Under the Microscope. Best viewed with headphones on. Geere on the sound:

Here’s how it works. There are two melodic saw wave drones separated by an octave – the higher represents cases, and the lower represents deaths. The chords that make them up each reflect the balance of different variants over time. As the data spikes, so does the filter cutoff.

The bassline reflects movement data. When people are moving around the city a lot, you hear the bassline move faster. During lockdown, when people were confined to their homes, it slows to a single beat for each bar.

Tags: , ,

A flag planted for every Covid-19 death

In fall 2020, Suzanne Brennan Firstenberg planted a flag for each American who died from Covid-19. There were over a quarter of a million flags at the time. The art installation is back at the National Mall, but this time there are over 660,000 flags. The scale is just…a lot.

Tags: , , ,

Data recorded in fabric quilt

Kim Moran-Jones quilted temperature minima and maxima in the UK, along with Covid-19 deaths on the perimeter in grayscale. Data and the physical fit well together.

Tags: , , ,

AI-generated movie posters

Noah Veltman fed an AI movie descriptions and made it generate images. The results are in quiz form so that you can guess the movies. I would give myself a poor rating for guessing the movies, but once you see the answer, you’re like oh yeah of course.

Veltman used VQGAN+CLIP, which you can find out more about here.

Tags: , , ,