Mapping where trees will grow

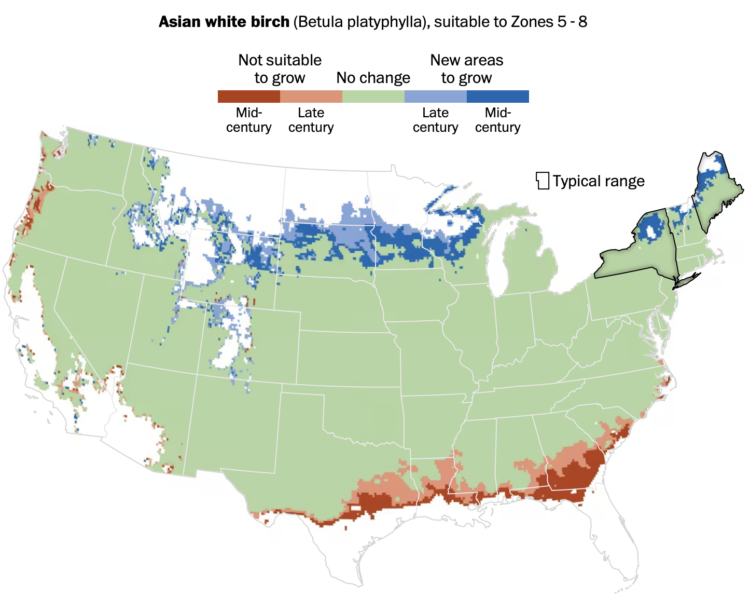
As the climate changes, the places that different types of trees will grow also shifts. Harry Stevens, for The Washington Post, provides the searchable maps to show the changes, based on data from the Davey Tree Expert Company.

Maybe the most interesting part is that there’s a “check my work” section at the end, which points you to the code to make the maps.

Tags: , ,

Tree Talk

Kelton Sears used a vertical scroll upwards to think about trees and time.

Tags: , , ,

Sequoia tree wildfire protection

For Reuters, Travis Hartman, Ally J. Levine, and Anurag Rao describe the measures taken to protect giant sequoia trees from wildfire. The trees have their own protections with thick bark and dropped branches. Firefighters help by watering the ground underneath and directing giant flames to other areas.

I’m into the vintage-y illustration. It starts you at the top of the tree and guides you down the trunk to the ground, with highlights along the way.

Tags: , , ,

Tree canopy and income

Ian Leahy and Yaryna Serkez for NYT Opinion look at income and tree canopy in major cities. Higher median income neighborhoods correlate with cleaner and cooler air.

Tags: , ,

Map of all the trees and forests

EarthArtAustralia mapped all of the trees and forests in the United States, based on data from researchers Hansen et al. at the University of Maryland.

We’ve seen minimalist maps like this before, but the introduction of 90m digital elevation data provides another dimension:

Pretty.

This map, among many others, is also available in poster form.

Tags:

Posted by in maps, trees

Tags:

Permalink

Where Christmas trees come from

For The Washington Post, Tim Meko and Lauren Tierney:

Before the 1930s, Christmas trees typically were cut down on an individual’s property or out in the wild. Now, tree farms in all 50 states (yes, Hawaii too) are where most Christmas trees come from, accounting for 98 percent of live Christmas trees brought into homes. These farms churn out many kinds of conifers, but two main regions — Clackamas County near Portland, Ore., and the Blue Ridge Mountains of North Carolina — produce the most.

I wonder if we can see a similar map for artificial Christmas trees.

Tags: , , , ,

Finding all of the trees in the world with machine learning

Descartes Labs used machine learning to identify all of the trees in the world where at least one-meter resolution satellite imagery is available. Tim Wallace with the maps:

The ability to map tree canopy at a such a high resolution in areas that can’t be easily reached on foot would be helpful for utility companies to pinpoint encroachment issues—or for municipalities to find possible trouble spots beyond their official tree census (if they even have one). But by zooming out to a city level, patterns in the tree canopy show off urban greenspace quirks. For example, unexpected tree deserts can be identified and neighborhoods that would most benefit from a surge of saplings revealed.

Tags: , ,

Mark Twain and The Big Stump: Can We Save Nature From Ourselves?

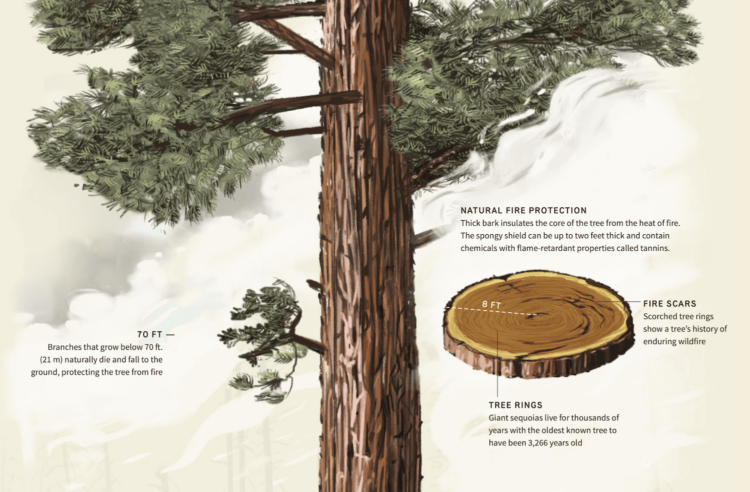
  As you enter Kings Canyon and Sequoia National Park from highway 180 there is a small little parking lot to the side with a couple of bathrooms and a non-descript, standard-issue, brown, wooden park

Urban Forestry In the Schoolyard: New PLOS ONE Research on Trees and Student Performance

0000-0002-8715-2896 Research into how nature impacts our well-being has shown that being outside makes us feel better. Images of nature alone have been shown to lift people’s mood. But is there any connection with how

Mapping perceived canopy tree cover in major cities

Treepedia, from the MIT Senseable City Lab, estimates perceived tree cover at the street level. They used panorama views from Google Street View to form a “Green View Index”, which they then mapped for major cities.

Treepedia measures the canopy cover in cities. Rather than count the individual number of trees, we’ve developed a scaleable and universally applicable method by analyzing the amount of green perceived while walking down the street. The visualization maps street-level perception only, so your favorite parks aren’t included! Presented here is preliminary selection of global cities.

Tags: , ,