DEB Numbers: FY2014 Wrap-Up

At the end of 2013, we presented DEB submission and award portfolio data examining the initial results of the preliminary proposal process, leading to DEB’s FY2013 awards. In this post, we provide a follow-up for the second round of awards funded under the preliminary proposal system in FY2014.

For a refresher, you can visit last year’s post.

The main takeaway from the 2014 data is that the following aspects of our portfolio do not exhibit changes associated with new system.

FY2014 Summary Numbers

In FY2014, DEB awarded 136 core program projects (comprised of 197 separate awards). The numbers and charts below all reflect counts of projects.

These projects were selected from 520 full proposals reviewed in DEB during October and November of 2013 by invitation under the Core Programs and LTREB solicitations, via the CAREER, OPUS, and RCN solicitations, or as co-review with another NSF program. The invited proposals had been selected from among 1629 preliminary proposals initially submitted in January of 2013.

Below, we present and discuss charts tracking the trends for several dimensions of our project demographics that were raised as concerns coming in to the preliminary proposal system. The numbers are presented as proportions for comparison across the review stages. However, the progressive winnowing of total numbers from preliminary proposals to awards means each step becomes more sensitive to small absolute changes.

In all cases of award trends shown below, the absolute change from FY2013 to FY2014 was no more than 10 projects.

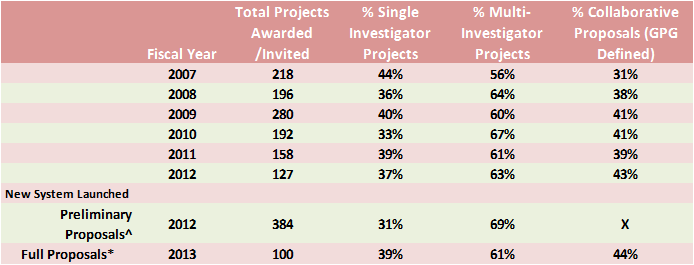
Individual and Collaborative Projects

As seen in the figure below, there was little year-to-year change in the performance of single investigator projects, the small change being consistent with prior inter-annual variation. Most of the apparent jump in the proportion of single investigator awards between the preliminary proposal and full proposal stages is an artifact of the counting method. As we discussed last year, the primarily single-investigator proposals in the CAREER and OPUS categories are not subject to the preliminary proposal screen and thus they make up a relatively larger portion of the full proposals than in years prior to the system and their absence depresses the single investigator proportion of the preliminary proposal counts relative to the historical full proposal baseline.FY14.1

Growth in the proportion of collaborative proposals in our award portfolio continues the generally upward trend from the past several years. We would expect a plateau at some point, but where that might be isn’t clear.Fy14.2

Readers may notice that the year-to-year increase in collaborative project awards for FY2014 is a few percentage points larger than the decrease in single investigator awards shown above. This difference reflects an increase in multi-institutional teams (which meet the NSF definition of “collaborative”) relative to intra-institutional arrangements (intellectual collaboration to be sure, but not a collaborative project).

Gender & Predominantly Undergraduate Institution (PUI) Status

Female PIs experienced a sizeable year to year drop in their proportion of awards this year, although the proportion of submissions at both preliminary and full proposal stages continues to increase. Such a drop is visually jarring, but not unprecedented. In absolute terms, this is a difference of eight projects across four clusters each with 1 or 2 full proposal review panels, essentially noise in the signal.

FY14.3

In contrast, PUIs experienced a large proportional increase in awards this year. Once again this is presumably due to noise within the programs’ decision-making (a difference of only 9 awards) since submissions did not change appreciably.

FY14.4

These single year changes in PUIs and female PIs appear to emerge from the full proposal review and program decision-making stage, not the preliminary proposal stage. This would seem to be a product of PO portfolio management, and such swings an inevitable result of the numerous dimensions of a “balanced portfolio” that need to be tended with a relatively small number of awards.

Early Career Scientists

As we discussed in the FY2013 Wrap-up, there are several imperfect metrics of early career investigator performance, with the “Beginning Investigator” check-box on the cover page being the most immediately visible but also the most inconsistently applied identifier.

FY14.5By the check-box identifier, beginning investigators continue to receive awards in proportion to full proposal submissions. A gap between preliminary and full proposal submission is expected because of the influx of proposals from the CAREER, OPUS, and RCN mechanisms which tend to have lower rates of beginning investigator PIs in DEB. The proportion of checked boxes at the preliminary proposal stage may also be elevated since the box is commonly, but incorrectly, checked in reference to persons other than the PI and at the preliminary proposal stage that could include persons from non-lead collaborator institutions.

The other identifier of career stage is the years since PhD of the PI.

With “Early-career” < 10 year post-PhD, “Mid-career” as 10 – 20 years post-PhD, and “Advanced-career” as >20 years, we can give a broader and more accurate overview of the PI population.FY14.7

FY14.6

From 2013 to 2014, the proportion of submissions decreased slightly for Early-career PIs (-2 percentage points), increased for Mid-career PIs (+6 pts) and decreased for Advanced-career PIs (-4 pts). Even with these changes, the Early-career cohort still represents the largest portion of submissions at 39%.

With respect to awardees, the PI profile shifted prominently toward Mid-career PIs from 2013 to 2014. That cohort increased by 10 pts to 35% of awards, which matches their submission rate. Advanced-career PIs dropped 3 pts, and make up the smallest portion of the award portfolio (32%) but their proportion of awards is still above submission levels. Early-career PIs represented a smaller portion of the 2014 awards (- 7 pts from 2013), and were somewhat underrepresented compared to submissions, constituting the remaining 33% of awards.

The changes in the awardee degree age profile from 2013 to 2014 resulted in a more even distribution between the three categories of Early-, Mid-, and Advanced-career but greater departures from their respective representation in submissions. However, it remains to be determined what distribution represents the “optimal” structure of the awardee population, or even on what criteria to judge optimality.

Success Rate

Success Rate
Fiscal Year 2007 2008 2009 2010 2011 2012 2012/2013 2013/2014 2014/2015
Preliminary Proposal* 22.0% 22.4% 23.0%
Full Proposal** 17.2% 15.3% 22.1% 13.5% 11.9% 16.8% 24.1% 26.2% N/A, awaiting budget
Overall*** 17.2% 15.3% 22.1% 13.5% 11.9% 16.8% 7.3% 7.6% N/A, awaiting budget
*= Ninvited_full / Nsubmitted_preliminary
**= Nawarded / (Ninvited_full + Ndirect_submission^)
***= Nawarded / (Nsubmitted_preliminary + Ndirect_submission^)
^Ndirect_submission = all proposals through 2012, after 2012 only CAREER, OPUS, RCN, co-review, and LTREB renewals taken to panel.

As we noted last year, we don’t put much value on “success rate” as a metric of program performance because it is driven by factors exogenous to DEB: the budget passed by Congress and the number and size of submissions sent in by the research community. However, we recognize its importance to you as a signal of program health and accessibility. In that regard, we are breathing a slight sigh of relief for the first departure, outside of extraordinary circumstances, from the downward slide that has dominated the past decade.


DEB Numbers: Community Satisfaction Survey Results

You may recall that way back in the first half of 2013 we invited the community by email and also via this blog to participate in a survey to gauge satisfaction with the preliminary proposal process in DEB and IOS.

The full results of the survey have now been published in BioScience. Our thanks to you for responding to our call to participate in great numbers and to the various discussants, readers, and reviewers who helped throughout the process.

We understand how strongly many people feel about these issues and appreciate your engagement as individuals with diverse experiences and perspectives. For every possible change we do or do not make, real lives are being impacted and that matters to us; and when 9 of 10 proposals are declined there will always be more individuals who “lose” than “win” even if the collective face of either group doesn’t change at all. We are ultimately people, trying to do our best to balance trade-offs with very real individual and collective consequences amidst constraints that extend well beyond any one of us. We are considering the responses very carefully, continuing to monitor outcomes, make adjustments, and evaluate the results of these changes with all available data.

Major Messages:

Respondents were most satisfied with the preliminary proposal requirement and mostly dissatisfied with the switch to a single annual deadline.

The respondents indicated that they see the DEB and IOS changes as a potential threat to the success of several different groups, especially to the ability of early career faculty to obtain funding. After the first complete review cycle, there were no immediate and obvious changes to the representation of these groups in the award portfolio.

General consensus was seen in responses between DEB and IOS and across various demographic divisions.

You can check the results out for yourself here:

http://bioscience.oxfordjournals.org/cgi/content/full/biu116?ijkey=WFhRM2sAgTLgzNa&keytype=ref (Web)

http://bioscience.oxfordjournals.org/cgi/reprint/biu116?ijkey=WFhRM2sAgTLgzNa&keytype=ref (PDF)

Note: you may hit a paywall if searching for the article directly from the web. These links should get you there directly.

Citation:

Leslie J. Rissler and John Adamec. Gauging Satisfaction with the New Proposal Process in DEB and IOS at the NSF. BioScience (September 2014) 64 (9): 837-843 first published online August 13, 2014 doi:10.1093/biosci/biu116


International Research Experience for Undergraduates (IREU) Supplements: Notes from the field

An International Research Experience for Undergraduates (IREU) supplement is a modification of the NSF-wide Research Experience for Undergraduates (REU) program. These IREU supplements are available exclusively to PIs in DEB. Traditional REU supplements available to NSF funded investigators support mentorship for undergraduate students to conduct independent research.

DEB has developed a partnership with CAPES, a funding agency in the Brazilian Ministry of Education. Through this partnership, DEB-funded investigators are eligible to apply for an IREU supplement to NSF in parallel with a Brazilian colleague who can apply for undergraduate funding through CAPES. If awarded, DEB funds the US student, and CAPES funds the Brazilian student so both students have an opportunity to conduct research at home and abroad. Over the course of the supplement, the two undergraduates overlap in the laboratory or the field and conduct a veritable student exchange.

This type of experience can spark a passion for science and research in undergraduate students. While the IREU supplement opportunity is still nascent, it has already provided numerous students the opportunity to conduct international research. Furthermore, programs like this allow international funding agencies to make use of their aligned interests and provide a greater funding impact through coordination and cooperation.

We had an opportunity to catch up with one of these students and her mentor as they shared some of their experiences in the IREU program:

~~~~~~~~~~~~~~~

Kendra Avinger

Undergraduate Student, Rutgers University

US Mentor: Dr. Siobain Duffy, Rutgers University

Brazil Mentor: Dr. F. Murilo Zerbini, Federal University of Viçosa

Duffy_IREU_student

Kendra Avinger, a DEB IREU student.

Tell us a little bit about your IREU experience thus far?

Surreal is the closest word to describe my IREU experience thus far. My mother is a second-generation Puerto Rican who raised my sister and me. The IREU experience is the type of horizon broadening opportunity she has always hoped for me.

In Brazil I am studying Begomoviruses, a group of viruses that cause disease in dicotyledonous plants, such as Tomato golden mosaic virus (TGMV) and East African cassava mosaic virus (EACMV). Begomoviruses were reported have major agricultural impacts with losses of 40 to 100% in Southeastern Brazilian states. I am learning to collect, catalogue, amplify, and sequence samples of Begomoviruses, as well as assisting multiple graduate students in the lab with their Begomovirus projects.

Have you participated in international activities before?

This IREU is the first international activity I have been involved in, in any capacity.

How did you prepare for your trip?

Mental preparation was key for me before arriving in Viçosa, Brazil. It is important to accept the overwhelming feeling of a new culture, location, and language without allowing it to overwhelm you and consequently, your work. To academically prepare for these differences, I enrolled in a Portuguese course tailored to speakers of the Spanish language, as I am fluent.

Tell us about working with your Brazilian counterpart?

My Brazilian counterpart, Hermano Pereira, and I overlapped at Rutgers for a week before I left for his University. Although our communications were filtered through two languages, we were inspired by our shared connection as young scientists.

Tell us about your mentors?

My mentor in Brazil is the phenomenal Dr. F. Murilo Zerbini. I am the first student to be sent to Brazil from the Duffy Lab, yet Professor Zerbini has had 3 students travel to Rutgers so far.

My US based mentor is Dr. Siobain Duffy. She understands that thriving graduate students are born from efficacious, confident undergraduates. She has helped me to realize that I have as much creative power as any professor, and to view myself on the same playing field. She gives me the confidence to move forward and share my own ideas.

What are your future professional/academic plans?

With my future, I hope to effect change eclectically. Public speaking, presenting, technical writing, and life sciences pull at my strong points thus far. I am not sure where I would like to end up long term, however, a short-term goal of mine after graduation is to manage a lab somewhere that is warm year-round, explore other interests, and eventually apply to graduate school.

~~~~~~~~~~~~~~~

Dr. Siobain Duffy

Assistant Professor, Rutgers University

How did you first get involved in conducting international research?

PI and IREU mentor, Siobain Duffy.

PI and IREU mentor, Siobain Duffy.

I am lucky that evolutionary virology is a very international field. Not just because cataloging viral diversity is a global pursuit, but some of the best experimental viral evolutionary biologists are in Europe, and some of the computational tools we use on a daily basis were developed in Africa.

My closest international collaborations both came from introductions made by a mentor of mine, who is very active internationally herself. As I was starting out as an assistant professor, she invited me to collaborate on some large multi-institution proposals. Some of them succeeded, some didn’t get funded, but the emailing back and forth created the personal connections required to start research collaborations.

Science has always advanced most quickly when ideas are shared internationally, and email, online dissemination of journal articles and VoIP technology [e.g. voice over internet technology] have made it trivial to collaborate with people on the other side of the planet.

What advice would you give other investigators who are considering applying for an IREU supplement?

My best advice is to start everything earlier than you think you need to – visas to the US take time, and undergraduates are less likely than grad students and postdocs to have gone through these processes before. The PIs on both sides will have to walk the students through obtaining housing, making sure their health insurance is set up, making sure they have working cell phones, etc.

What advice would you give to undergraduates, who may be inspired by Kendra’s work, and who are interested in getting involved in international research?

There are many more opportunities for international research exchanges than undergrads realize there are! If you are working in a lab with international collaborations, ask if there is a chance to participate, and if there is time to write an IREU proposal for your work. Look for REUs with an international component! Look for post-baccalaureate programs, especially in countries where you are already proficient in the main language. A former undergraduate researcher in my lab is working in a German science lab doing exactly this.

And don’t sweat it if your research doesn’t turn international at this stage – if you stay in science, there’s a very good chance you can work and live abroad for a while.

Has the IREU supplement impacted your collaborations with international investigators?

NSF’s partner in this exchange, CAPES, has been so pleased with the project they are funding additional Brazilian undergrads to come to my lab this fall. Because I have visited my collaborator’s lab in Viçosa, I know these students, and they already have some sense of who I am and what their time in the US will be like – which makes it much less intimidating to get on the plane. I will be looking for ways to write more IREU students into projects in the future.


DEB Numbers: Preproposals and Collaboration, Part 2

This DEB Numbers post is a continuation of our previous post, here, where we laid out some of the measures of collaboration that are available to us in DEB. If you are new to DEB Numbers posts, we suggest you read our introductory message to familiarize yourself with some of the conventions we use here to describe what can be confusing information.

How many collaborators?

Beyond the presence/absence of GPG-defined collaborative proposals or presence/absence of Co-PIs on a project, we have some additional information that may shine a light on other facets of the collaboration question.

Clearly, an immediate follow-up question to presence/absence of collaboration is “how many are involved?”  In answer to this we can take a look at the average number of names on a project’s cover sheet(s) or the average number of institutions on a project’s budget(s).  The following tables exclude preliminary proposals because those projects are submitted by single institutions without budget information and so do not reliably provide complete information for persons or institutions. (The Excel template required for January, 2013 preliminary proposals was an attempt to improve capture of such info.)

Mean PI/Co-PI Names on Full Proposal Project Cover Sheet(s) for DEB Core Program Panel Submissions and Awards FY2007-FY2013

Numbers3b-1

Mean Institutions in Full Proposal Project Budget(s) for DEB Core Program Panel Submissions and Awards FY2007-FY2013

Numbers3b-2

*Tentative numbers for FY2013 under the Continuing Resolution budget scenario.

For both mean persons and mean institutions per project submission, we do not see any large change in FY2013 which would signify some sort of catastrophic impact on collaboration habits in project submissions.

The numbers for both mean persons and mean institutions on the awards, however, may give one pause.  Especially if plotted, the visualization can seem frightening:

Numbers3b-3

For all four measures of the awards, FY2013 is down from FY2012. In three of the four cases the FY2013 drop is the largest single year change in the set.  Since we saw in the previous post on collaborations that the proportions of single investigator versus collaborative project awards had not changed, this observed change requires that the size of groups involved in collaborative projects expected to be awarded for FY2013 are somewhat smaller than in previous years.  How much smaller? Well, the mean changes by ~.25 in the largest drop so we are looking at one fewer participant for every four multi-investigator project awards.  This is definitely something we are keeping an eye on but, given the unique circumstances in FY2013, our interpretation is it does not yet signal a problem with the review system but rather a trade-off with the budget.

Such a decrease actually makes sense in the context of a limited and uncertain budget.  Especially given the focus on funding rates and maximizing the number of projects awarded, programs have an incentive to spread the available funding over as many projects as possible.  Programs also seek balance between multi-investigator and single investigator project awards. If multi-investigator projects with smaller collaborative groups cost less than similar projects supporting larger groups of PIs and Co-PIs, the funds saved on the less costly projects could enable more awards to be made in total.

Inter-generational Collaboration

The last measure we will take a look at in this discussion highlights a specific aspect of the collaboration concern that was raised in some quarters, namely that the submission limit would stifle collaboration between younger and older researchers.  The best measure we have to look at such inter-generational collaboration is the terminal degree year of the researchers. This number is part of each individual’s FastLane profile.  We can capture that data for the participants in each multi-investigator project and calculate the number of years between the most recent and most remote terminal degree years on each project.  The distribution of these degree year ranges was compiled for DEB Core Program Panel Multi-Investigator Projects awarded from FY2007 through FY2013.  These distributions are presented below, without further commentary, as a series of box-and-whisker plots.

Numbers3b-4

We hope these two posts have started you thinking about collaboration and look forward to continuing the discussion in the comments and future posts.


DEB Numbers: Preproposals and Collaboration, Part 1

A topic we have been interested in since long before the launch of the two-stage review process is how collaboration plays into the review process in DEB.  In this post, we explore the various definitions of collaborative proposals and look at measures of the extent of collaboration in DEB project submissions and awards.  If this is your first DEB Numbers post, I suggest you read our introductory message to familiarize yourself with some of the conventions we use here to describe what can be confusing information.

What does collaboration mean in DEB?

We mentioned in a previous post that the NSF GPG recognizes two different arrangements as “collaborative proposals“: 1) single proposal jackets with additional institutions as subawards, and 2) linked proposal jackets submitted by multiple institutions. Only the second arrangement is explicitly labeled as “Collaborative Research:…” in the project title.  The common feature of these two arrangements is that the full proposal projects contain budgetary information submitted by two or more organizations.

In conversation, DEBers often use the shorthand term “collabs.”  This use usually refers to only those projects consisting of multiple linked proposal jackets with “Collaborative Research:…” titles.  We are particularly interested in this subset of collaborative proposals internally because they pass through review as a single unit but become individual grants if awarded and that has effects on the processing workflows.

DEB Numbers posts report collaborative proposal information incorporating both arrangements described in the GPG.

We also recognize that there is more to collaboration than organizations coordinating project budgets. Counts of GPG defined “collaborative proposals” do not account for the vast majority of cooperative arrangements that fall under a reasonable general-public understanding of collaboration.  For instance, Co-PIs from the same university in the same or complementary fields are clearly taking part in collaboration but only a single institution receives an award.  A foreign counterpart providing access to a collection or dataset may be thought of as a collaborator (and may even have provided what solicitations call a “letter of collaboration” confirming their willingness to provide support to a project) but is not a PI or Co-PI and their organization is not an awardee. Neither of those constitutes a “collaborative proposal” but they are aspects of collaboration that interest us. However, data on such collaborations are not always systematically captured during the submission process or award life-cycle.

Our abilities to scrape meaningful data on these deeper facets of collaboration from NSF records vary, often from difficult to currently unavailable.  But, there is a lot of promise in the future.  The development of altmetrics in the wider community, StarMetrics within federal agencies, and the continued upgrading and replacement of old systems with new ones designed with data needs in mind suggest that in a couple of years we will have operational tools to better explore project collaboration.

One immediate development in this direction is the migration of project reporting from FastLane to Research.gov. Current grantees should have heard about this by now.  The switch will make the information in awardee reports easier to draw out and analyze. However, it will also be a fresh start.  We do not expect to have backward conversion of old records.  At the program level, we do not know what all the outputs and data products from the new form will look like (either internal or external to NSF). It will definitely require time and exploration to get enough data into the reporting system to figure out how to recombine it with existing data sources and produce new insights.

Those limitations in mind, there are several pieces we can look at today to give a picture of the landscape of collaboration over the last several years.

For starters we can look at the numbers of individuals appearing on project cover pages.  We can also look at the numbers of institutions represented in project budgets.  With these numbers we can look for trends in the representation of various collaborative arrangements in the submission and award portfolios.

Proportions of Three Collaboration Strategies in the Portfolio of Project Submissions to DEB Core Program Panels FY2007-FY2013

Numbers3a-1

^Institutional involvement beyond the lead organization on a proposal jacket is captured in budgetary information.  This data is not generated in the submission of preliminary proposals.

*Tentative numbers for FY2013 under the Continuing Resolution budget scenario.

Here we have the data for three types of collaboration strategies:  Collaborative Proposals (GPG-definition requiring 2 or more institutions involved in the project budget), Multi-investigator projects (a broader concept of collaboration including all projects with Co-PIs even if from a single institution), and Single Investigator Projects (no named collaborations with other institutions or Co-PIs).  There is not much to interpret, the relative contributions of each collaboration strategy to the submitted project portfolio has been amazingly constant even through the FY2010 post-stimulus submission spike and preliminary proposal debut.  The only notable feature is the apparent relative increase in formal collaborative proposals at the FY2013 full proposal stage.  That change would appear to run counter to some of the concerns voiced at the launch of the two-stage review process.  However, that number is also a decent, if imperfect, proxy for the proportion of collaborative proposals in invited preliminary proposals.  When viewed in that context, it is less exciting.

Proportions of Three Collaboration Strategies in the Portfolio of Awards or Invitations from DEB Core Program Panels FY2007-FY2013

Numbers3a-2

*Tentative numbers for FY2013 under the Continuing Resolution budget scenario.

Here we see a bit more variation over the reviewed period, but we are also considering a much smaller population.  Again, however, the numbers coming out of FY2013 are not out-of-place when compared against the range of values encountered since FY2007.  If the X in this table were replaced with the 43% collaborative proposals from the FY2013 full proposal submission portfolio, it too would fit right in. Regarding the preliminary proposals in FY2012, Multi-Investigator Projects appear to have fared a little better than normal at the point of invitation but we have only a single data point and that difference must be interpreted in light of several factors: single investigator CAREER projects were not part of that review stage, and both panelists and Program Officers were aware of publiczied concerns about negative impacts on collaboration and could have responded with behavioral changes.

These data initially suggest that the two-stage review process is not having an effect on collaborative proposal submissions or outcomes. “But,” you may say, “this data only reflects presence/absence of a technical marker of collaboration, what about measures of ‘how much’ collaboration is happening?”  Currently such information pushes the limits of our ability to glean data from the records, but we will take a look at what we can in part two.


DEB Numbers: Preproposals and Collaboration, Part 1

A topic we have been interested in since long before the launch of the two-stage review process is how collaboration plays into the review process in DEB.  In this post, we explore the various definitions of collaborative proposals and look at measures of the extent of collaboration in DEB project submissions and awards.  If this is your first DEB Numbers post, we suggest you read our introductory message to familiarize yourself with some of the conventions we use here to describe what can be confusing information.

What does collaboration mean in DEB?

We mentioned in a previous post that the NSF GPG recognizes two different arrangements as “collaborative proposals“: 1) single proposal jackets with additional institutions as subawards, and 2) linked proposal jackets submitted by multiple institutions. Only the second arrangement is explicitly labeled as “Collaborative Research:…” in the project title.  The common feature of these two arrangements is that the full proposal projects contain budgetary information submitted by two or more organizations.

In conversation, DEBers often use the shorthand term “collabs.”  This use usually refers to only those projects consisting of multiple linked proposal jackets with “Collaborative Research:…” titles.  We are particularly interested in this subset of collaborative proposals internally because they pass through review as a single unit but become individual grants if awarded and that has effects on the processing workflows.

DEB Numbers posts report collaborative proposal information incorporating both arrangements described in the GPG.

We also recognize that there is more to collaboration than organizations coordinating project budgets. Counts of GPG defined “collaborative proposals” do not account for the vast majority of cooperative arrangements that fall under a reasonable general-public understanding of collaboration.  For instance, Co-PIs from the same university in the same or complementary fields are clearly taking part in collaboration but only a single institution receives an award.  A foreign counterpart providing access to a collection or dataset may be thought of as a collaborator (and may even have provided what solicitations call a “letter of collaboration” confirming their willingness to provide support to a project) but is not a PI or Co-PI and their organization is not an awardee. Neither of those constitutes a “collaborative proposal” but they are aspects of collaboration that interest us. However, data on such collaborations are not always systematically captured during the submission process or award life-cycle.

Our abilities to scrape meaningful data on these deeper facets of collaboration from NSF records vary, often from difficult to currently unavailable.  But, there is a lot of promise in the future.  The development of altmetrics in the wider community, StarMetrics within federal agencies, and the continued upgrading and replacement of old systems with new ones designed with data needs in mind suggest that in a couple of years we will have operational tools to better explore project collaboration.

One immediate development in this direction is the migration of project reporting from FastLane to Research.gov. Current grantees should have heard about this by now.  The switch will make the information in awardee reports easier to draw out and analyze. However, it will also be a fresh start.  We do not expect to have backward conversion of old records.  At the program level, we do not know what all the outputs and data products from the new form will look like (either internal or external to NSF). It will definitely require time and exploration to get enough data into the reporting system to figure out how to recombine it with existing data sources and produce new insights.

Those limitations in mind, there are several pieces we can look at today to give a picture of the landscape of collaboration over the last several years.

For starters we can look at the numbers of individuals appearing on project cover pages.  We can also look at the numbers of institutions represented in project budgets.  With these numbers we can look for trends in the representation of various collaborative arrangements in the submission and award portfolios.

Proportions of Three Collaboration Strategies in the Portfolio of Project Submissions to DEB Core Program Panels FY2007-FY2013

Numbers3a-1

^Institutional involvement beyond the lead organization on a proposal jacket is captured in budgetary information.  This data is not generated in the submission of preliminary proposals.

*Tentative numbers for FY2013 under the Continuing Resolution budget scenario.

Here we have the data for three types of collaboration strategies:  Collaborative Proposals (GPG-definition requiring 2 or more institutions involved in the project budget), Multi-investigator projects (a broader concept of collaboration including all projects with Co-PIs even if from a single institution), and Single Investigator Projects (no named collaborations with other institutions or Co-PIs).  There is not much to interpret, the relative contributions of each collaboration strategy to the submitted project portfolio has been amazingly constant even through the FY2010 post-stimulus submission spike and preliminary proposal debut.  The only notable feature is the apparent relative increase in formal collaborative proposals at the FY2013 full proposal stage.  That change would appear to run counter to some of the concerns voiced at the launch of the two-stage review process.  However, that number is also a decent, if imperfect, proxy for the proportion of collaborative proposals in invited preliminary proposals.  When viewed in that context, it is less exciting.

Proportions of Three Collaboration Strategies in the Portfolio of Awards or Invitations from DEB Core Program Panels FY2007-FY2013

Numbers3a-2

*Tentative numbers for FY2013 under the Continuing Resolution budget scenario.

Here we see a bit more variation over the reviewed period, but we are also considering a much smaller population.  Again, however, the numbers coming out of FY2013 are not out-of-place when compared against the range of values encountered since FY2007.  If the X in this table were replaced with the 43% collaborative proposals from the FY2013 full proposal submission portfolio, it too would fit right in. Regarding the preliminary proposals in FY2012, Multi-Investigator Projects appear to have fared a little better than normal at the point of invitation but we have only a single data point and that difference must be interpreted in light of several factors: single investigator CAREER projects were not part of that review stage, and both panelists and Program Officers were aware of publicized concerns about negative impacts on collaboration and could have responded with behavioral changes.

These data initially suggest that the two-stage review process is not having an effect on collaborative proposal submissions or outcomes. “But,” you may say, “this data only reflects presence/absence of a technical marker of collaboration, what about measures of ‘how much’ collaboration is happening?”  Currently such information pushes the limits of our ability to glean data from the records, but we will take a look at what we can in part two.