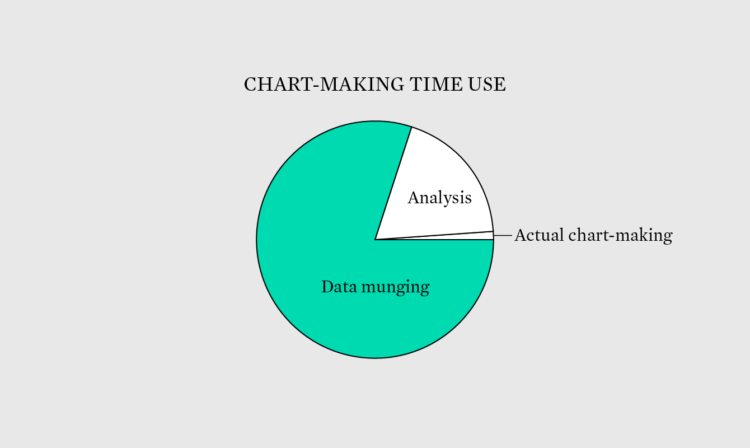
Welcome to issue #206 of The Process, the newsletter for FlowingData members that looks closer at how the charts get made. I’m Nathan Yau, fully boosted and ready to go. This week I finished the data munging section of the upcoming Visualization in R course, and lately I’ve been munging much more than visualizing. It’s not the most glorious of tasks, but it is necessary.
Become a member for access to this — plus tutorials, courses, and guides.