Hack and fish … for recombination in the SARS group


Following the current flow, we have had a few recent coronavirus posts here on the Genealogical World of Phylogenetic Networks. In this post, I'll show the results of a little experiment coming back to David's original post on the topic. Can we use trees to "fish" for evidence of recombination?

As David pointed out, even when we use a phylogenetic-tree inference method to analyze virus genomes, we don't really end up with a phylogenetic tree. Instead, we have a tree reflecting genetic similarity, which will reflect the phylogeny to some unknown extent. The main problem with virus genomes, however, is that they easily recombine — and thus different parts of a virus genome may have different evolutionary histories. A single tree cannot reflect this.

This does not mean that trees cannot tell is something about virus evolution. However, these trees become part of a fishing exercise, looking for different possible historical pathways, which may reflect recombination events.

The tree

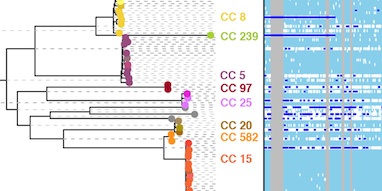
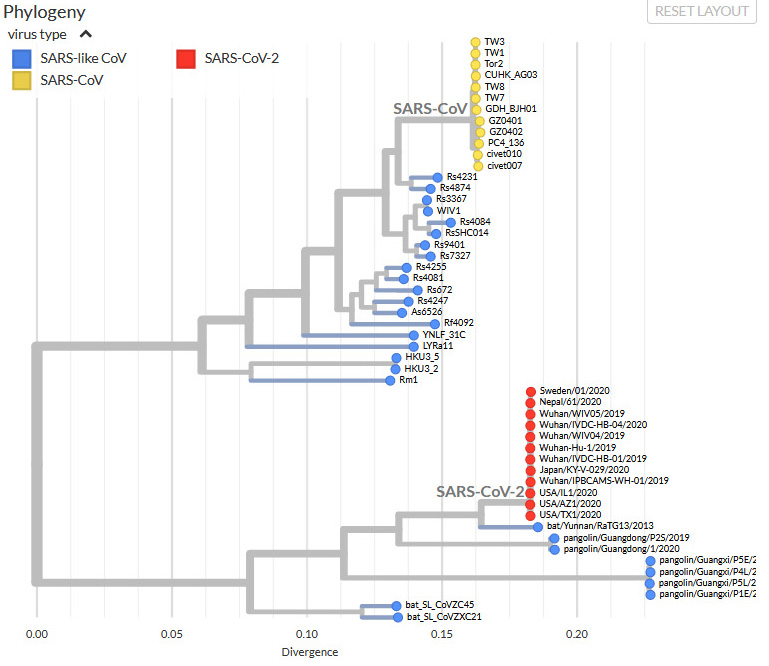
Our SARS harvest matrix includes about a dozen sequence groups, which we have labeled Type 1 (the original SARS-CoV) to 9b. Type 7 is the new SARS-CoV-2. For my experiment here, I picked one place-holder sequence per main type (to speed up calculation time). I added two more types: the newly found direct sister of SARS-CoV-2; and some "unclassified" SARS-like viruses from pangolins, which earlier were proposed as sisters, as shown in this tree from the GISAID web page.

The phylogenetic neighborhood of SARS-CoV-2 (GISAID, screenshot captured 3/6/2020). Note the flatness of the CoV(-1; yellow) and CoV-2 (red) subtrees.

GISAID doesn't give the GenBank accession numbers, so we cannot easily say whether our sample matches theirs. However, the tree we can infer from the complete genomes (high-divergent, non-alignable regions excluded) looks very similar, as shown next, and some of the labels match up.

Fig. 1 Maximum likelihood (ML) tree inferred for our sample using (old, v.8.0.20) RAxML. Roman numbers refer to earlier defined Types 1–9 (Tree and viruses – the SARS group), Arabic numbers give nonparametric bootstrap (BS) support based on 100 BS pseudoreplicates (number of neccessary BS replicates determined by the extended majority rule criterion). Branches without Arabic number are unambiguous (BS = 100).

Most importantly, all but three branches have unambiguous support: the phylogeny of this sample is resolved. Unfortunately, as our recurring readers already know, this nearly resolved tree simplifies a much more complex situation.

The Neighbor-net with recombinations and mutational trends (arrows, connectives; cf. Tree and viruses – the SARS group).

Hack and slash

A simple method to fish for different evolutionary histories in a genome is to cut the virus genomes into sub-sequences, infer a tree for each sub-sequence, and then compare the trees. Most researchers compare trees by showing them and discussing which one makes most sense. Here is an example from Corman et al. (2014), who searched for the root of MERS (Middle East Respiratory Syndrome) virus, an illness closely related to SARS.

Reprint of Corman et al. 2014, fig. 3 with colors added to EriCoV (green) and HKU/BtCoV (olive) groups

Each tree in their Fig. 4A and B (Bayesian majority rule consensus trees) was inferred from a different part of the genome. Corman et al.'s focus was to root the MERS viruses by identifying a better outgroup. However, note that the new sister-group (red, green stars – sister to MERS; orange stars – sister to someone else) moves, and so does the green EriCoV clade and the olive HKU/BtCoV group (clade in some trees and grade in others). Do some of these trees get it wrong? Or is, eg. NeoCoV the product of reticulate evolution (here: ancient recombination)? Some parts of its genome might be derived from a common ancestor with MERS (blues), and others from a common ancestor with KW2E (black) and EriCoV (green).

Our complete matrix has 27,333 characters, providing nearly 6,000 distinct alignment patterns (abbreviated DAP, below), which is a lot — the GISAID link above also provides a graphical representation of site divergence. However, probabilistic tree inference methods (ML, Bayes) can handle moderate to high levels of divergence in the data. On the other hand, they also need a certain amount of data to perform well (see also: Inferring a tree with 12000 [or more] virus genomes). So, for my experiment, I hacked the matrix into nine bits of equal size, ie. each submatrix has a bit more than 3,000 nucleotides, providing between 615 (bit #5) and 1029 (bit #1) DAPs.

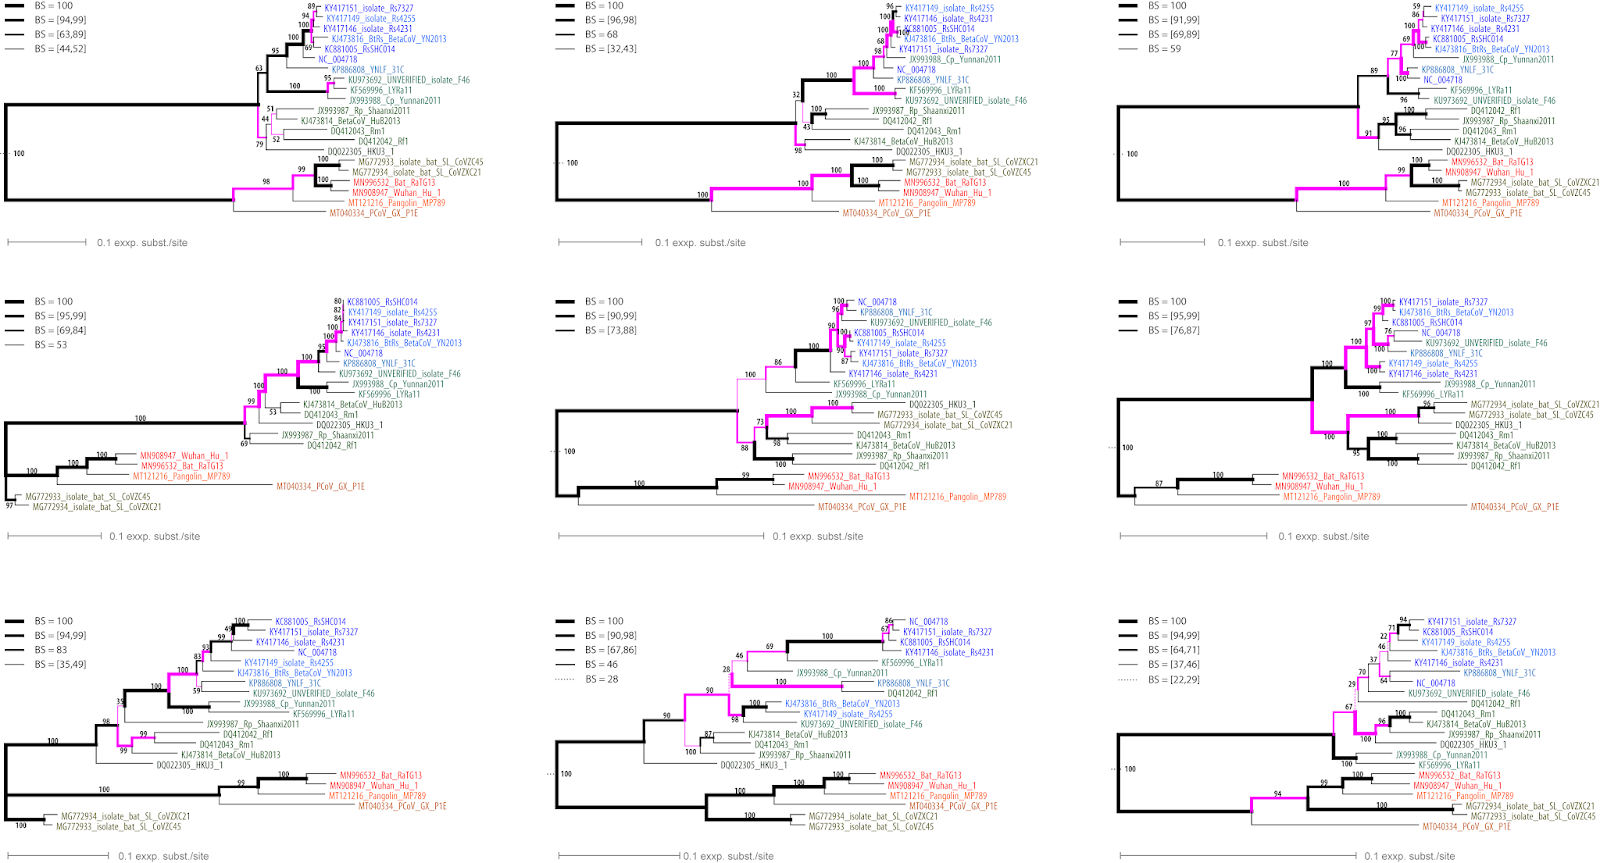
Fig. 2 Nine ML trees with BS support annotated along branches, each based on a ~3000 nucleotide long bit of the genomes (ordered left-right, top-bottom). Purple highlights branches conflicting with the complete genome tree.

Our nine trees (shown above) are not badly resolved, as most branches get substantial support. But they are not congruent. If we are dealing with recombination, then we might assume that all of these trees do show an actual aspect of the evolutionary history of the genomes. That is, they are all right and wrong, at the same time.

Moreover, we have high supported clades conflicting with the complete genome tree's (Fig. 1) topology. The signal issues, due to recombination (see Trees and viruses...), did not decrease branch support. That is, 6,000+ DAP is a lot, and recombination only affects a part of the complete genome, possibly quite a small part.

Non-trivial evolution needs more than trivial graphs

To depict the reticulate phylogeny of the virus sample, we need to consider the differences seen in the hacked-and-slashed matrix trees. This can easily be illustrated using a network, instead of a set of trees, as shown here.

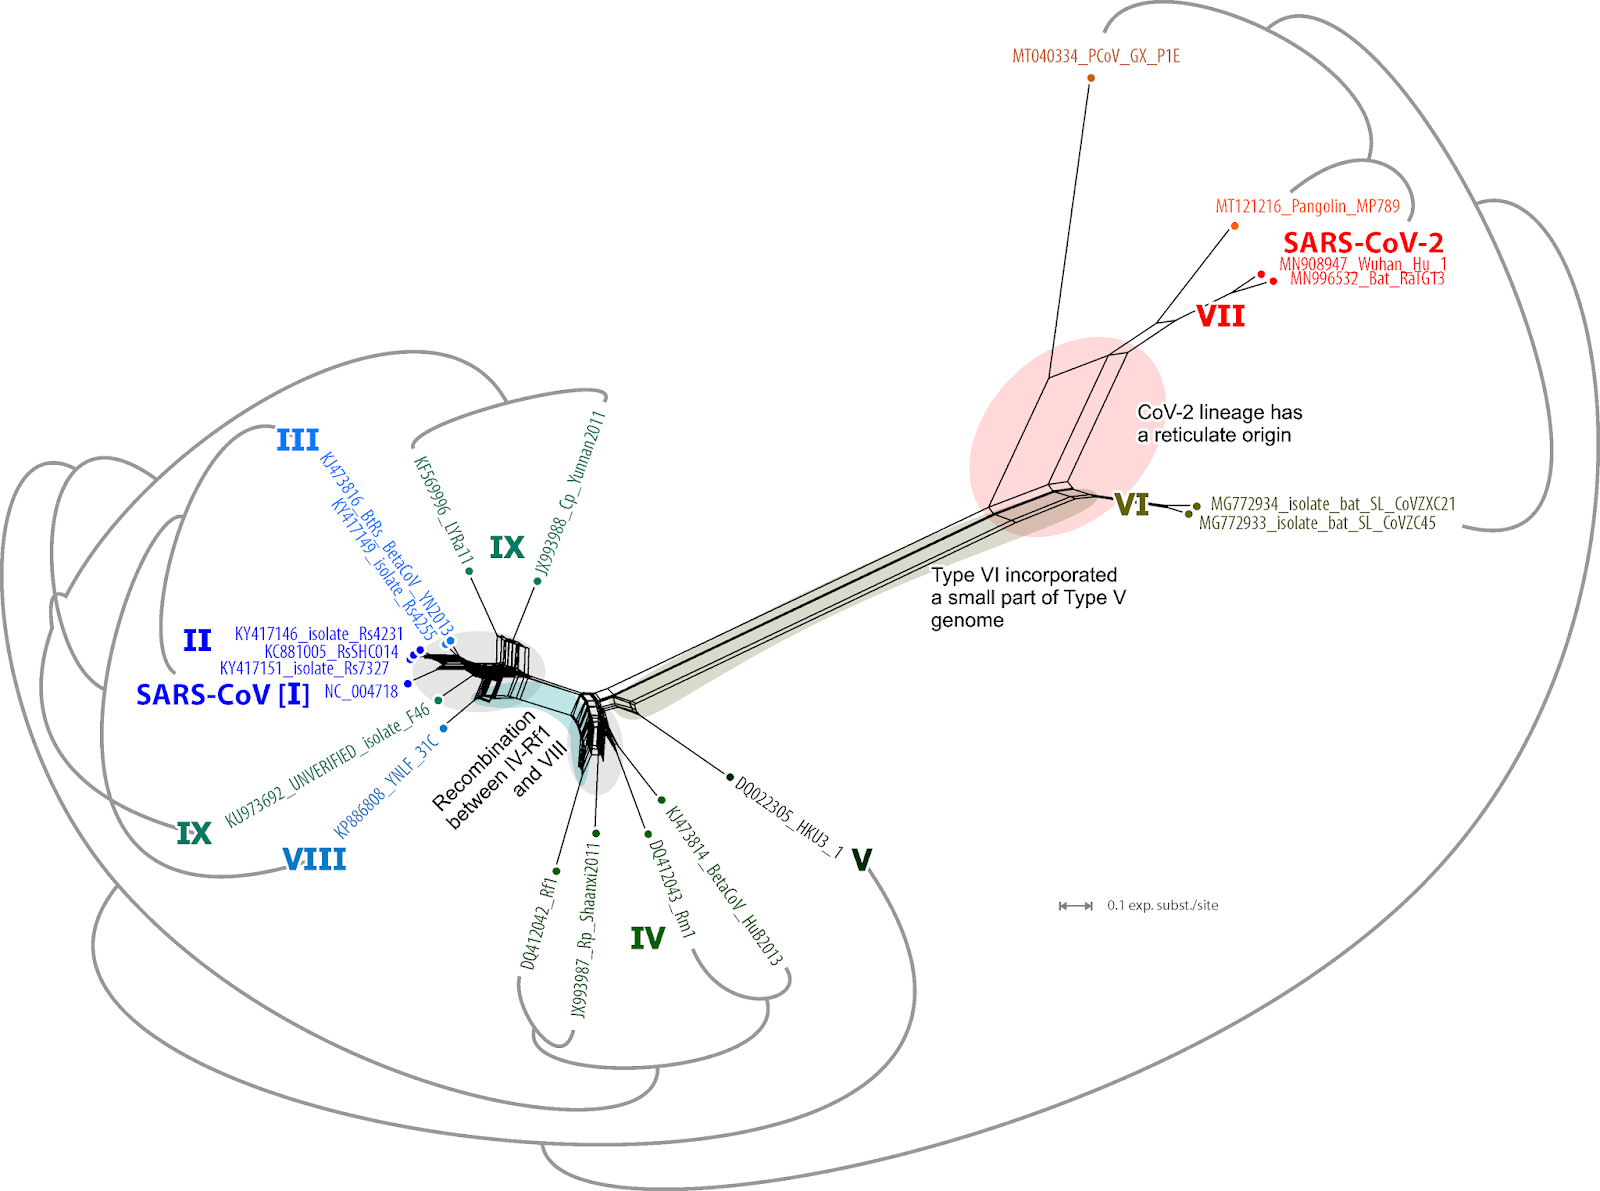
Fig. 3 A (strict) consensus network of all nine trees, in which the edge lengths give the sum of the branch lenghts in the tree sample. The gray brackets give the topology of the near-fully resolved complete genome tree.

The graph above is a phylogenetic network: the competing edge bundles represent the different inferred histories of bits of the genomes. The SARS-CoV-2 lineage seems to be the product of (ancient) recombination, and recombination also played a role in forming the members of the original SARS-CoV group.

Fig. 4 Pruned consensus network showing only the CoV(-1) lineage exhibiting various levels of recombination within and between clades as defined by the complete genome tree (tree sample sames as in Fig. 3).

Consensus networks can also be used to summarize the support for alternative splits, as shown next.

Fig. 5 Sum-support consensus network based on the bit-wise BS analyses (111/112 pseudoreplicates generated per bit). Only splits are shown occurring in at least 20% of all BS replicates, i.e. splits supported by at least two bits, trivial splits are collapsed. Colored splits represent according groups/clades in the full-genome tree (Fig. 1). Inlet: 'splits rose' showing competing splits patterns within Types II and III (cf. according subtrees/-trunks in Fig. 2 and Fig. 4).

In contrast to the networks before (Figs. 3, 4), generated using the same algorithm*, the BS consensus network in Fig. 5 is not a phylogenetic network. The boxes don't reflect disparate histories of parts of the genomes but the varying support for competing topological alternatives. By summing up the bit-wise BS analyses instead of bootstrapping the entire data (the BS consensus network for the full data, Fig. 1, shows only two boxes), we get a better idea which aspects of the all-genome tree find robust support across the genome.**

Conclusion

Sub-dividing an alignment is a really quick way to fish for evidence of recombination, especially when one then uses a consensus network to summarise the resulting partial trees.

For interpretation, a tree is a very simple, trivial, and hence appealing graph: A is sister to B and so on. Even a child can interpret a tree. Networks are already visually more challenging, but whenever an organism's evolution doesn't follow a tree (as for viruses), we shouldn't use a tree to depict its phylogeny (or reconstruct its evolution).


Data availability

The dataset used for our experiment is a taxon subset of the original data set, available via figshare (with a permanent, hence, citable DOI):
Grimm GW, Morrison D. 2020. Harvest and phylogenetic network analysis of SARS virus genomes (CoV-1 and CoV-2). figshare Dataset. https://doi.org/10.6084/m9.figshare.12046581 

References

Corman VM, Ithete NL, Richards LR, Schoeman MC, Preiser W, Drosten C, Drexlera JF (2014) Rooting the phylogenetic tree of Middle East respiratory syndrome coronavirus by characterization of a conspecific virus from an African Bat. Journal of Virology 88: 11297–11303.


* SplitsTree includes five options to determine "edge weights" (= edge-lengths) in case of Consensus networks: "median" and "mean" average the branch-lengths in the tree sample; "count", the setting used to generate Support consensus networks, counts how often a certain taxon bipartition (split) is found in the tree sample – an edge length is proportional to the frequency of a split; "sum", used here to generate the first network, summarizes the branch-lengths; and "none" discards both branch-lengths and split frequency.

** A split supported only by one of the nine bits, even if unambiguous, ie. present in all 111 (112) per bit BS replicates, will not be represented in the sum-Support consenus network using a cut-off of 20%.

† The complete set of ML analyses took 20 min on a stand-alone computer; consensus networks are generated in a blink, and take hardly a minute even when using trees with many leaves.

Using Median Networks to study SARS-CoV-2


One software package essential for my research has been the free-/shareware NETWORK by Fluxus Engineering. NETWORK can (now) read in PHYLIP- (and NEXUS-)formatted sequence files to infer Reduced Median (RM) and Median-joining (MJ) networks. The people behind NETWORK have just landed a sort of scientific scoop by publishing a Phylogenetic network analysis of SARS-CoV-2 genomes in PNAS — this is the first such network to be published (appearing the same day as our previous blog post).

Why use Median networks

A full Median Network depicts all possible direct mutational links between the sampled sequences in a data set, hence, is rarely seen in published papers. Here's an example from my own (unpublished) research on oaks.

A full Median network for the 5S nrDNA intergenic spacer (5S-IGS) data of Mediterranean oaks
(Quercus sect. Ilex), The numbers on the edges give mutated alignment positions; the
abbreviations show the the provenance of the sequences (reflecting inter-population
and intra-genomic variation); and the coloration shows the general 5S-IGS variant
(genotype, also called "ribotype" in the literature)

Such graphs can easily get very complex, meaning that the full Median network is often impractical. So, NETWORK gives you two practical options to analyze the data while decreasing the complexity of the resulting graph. One can:
  1. infer the so-called Reduced Median networks (Bandelt et al. 1995; mostly used for binary or RY-transformed data) or
  2. apply the Median-joining (MJ) network algorithm (Bandelt et al. 1999).
[PS: When choosing an inference in NETWORK, you can view a how-to-do step-by-step explanation via Help → About.]
    Basically, the MJ network is a summary of the possible parsimony trees for the data, not unlike a strict consensus network of most-parsimonious trees. NETWORK's in-built viewer allows browsing through the parsimony trees that make up the network. The subtle but very important difference is that the sampled sequences are not regarded exclusively as network tips but can be resolved as internal nodes of the graph, the so-called medians. A median represents the "ancestral type" from which the more terminal types were evolved. So, in contrast to a phylogenetic tree (or consensus network), the MJ network can depict ancestor-descendant relationships (see also: Reconstructing ancestors in splits graphs; Clades, cladograms, cladistics, and why networks are inevitable).

    This makes Median (in particular MJ) networks more proficient to investigate virus phylogenies than phylogenetic trees. Because we have to expect that our sample includes ancestral and derived variants of the virus' RNA: some of the OTUs are expected to be placed on internal nodes of the phylogenetic tree/network.

    So, Forster et al., in their paper, harvested a data repository dedicated to epidemological data (GISAID), and provided the following MJ network based on complete CoV-2 genomes (click to enlarge it).


    Forster et al. highlight some (tree-like) features of their MJ network that fit with individual patient travel histories and assumed virus propagation patterns (their data and NETWORK-files can be found here).

    The central part of Forster et al.'s MJ network is characterized by several boxes.

    Close-up of the central part, the differentiation of the original Type A (as defined by the bat sistergroup) into B and C types. Note that most of the (likely synonymous) mutations during the intitial differentiation phase are transitions from U to C, assuming the sistergroup can inform the ingroup root. The reference sequence (Wuhan 1; NC_045512, sampled Dec 2019) has an ancestral B type, derived from a globablly distributed A-type intermediate between B and the not-sampled last common ancestor ("original genome").

    There is a reason why you don't find a MJ network in our last post on coronaovirus genomes (aside from taking non-annotated data from gene banks and hence we lacked quick-to-access background information). This is that inferring a MJ network for the CoV-2-group seems premature at this point. Its interpretation as a phylogenetic network (arrows above) is problematic because we have parallel edges in the graph, and thus do not have unique evolutionary pathways to be inferred.

    Let's look at what I mean.

    Homoplasy is bad, but recombination is worse

    In the "Significance" section of their paper, Forster et al. state
    These genomes are closely related and under evolutionary selection in their human hosts, sometimes with parallel evolution events, that is, the same virus mutation emerges in two different human hosts. This makes character-based phylogenetic networks the method of choice for reconstructing their evolutionary paths and their ancestral genome in the human host.
    "Parallel evolution events", ie. homoplasy, are the major shortcoming of Median networks, when we interpret them as phylogenetic networks. In a phylogenetic network, a reticulation (forming a "box" in the graph) represents a reticulation event; and the most common in viruses are recombinations.

    Let's take the following simple example with four sites (SNPs – single nucleotide polymorphisms) mutated with every generation of the virus, plus one homoplasy (transition from A to G at the forth SNP) and a final recombination event.


    Not including the recombinant, the MJ network (below) depicts the true phylogenetic network, which, in the absence of a reticulate event, is a tree. However, one benefit of the MJ network for the use of non-trivial phylogenies, is that the graph is not restricted to dichotomous speciation events: one virus sequence may be source of more than two offspring. The commonly seen phylogenetic trees struggle with such a data situation: they assume that all ancestors are gone (not represented in the data) and have been replaced by exactly two offspring.

    Note: The inferred MJ network is an undirected, unrooted graph.
    By knowing the source (the all-ancestor), we can interpret it as
    a directed phylogenetic network.

    When we include the recombinant in this analysis, the MJ network depicts what could be a phylogenetic network. However, it is a wrong one.

    The West-1/East-ancestor recombinant is resolved as hybrid/cross of
    West- and East-ancestors, and West-2 as cross of West-1 and the
    Recombinant. False edges are in red.

    It is wrong because Median networks, like parsimony or probabilistic trees, assume that every difference in the sequence is due to a mutation. The East-ancestor mutated only the last of the SNPs in the example. The West-lineage mutated the first SNP, then the third one, and finally (parallel to the East-lineage), the last SNP. Only the last 'West' mutation is found in the recombinant, because it recombined the first half of the West-1 genome with the second half of the East-ancestor.

    However, homoplasy on its own can also produce reticulations in the network, as shown next.

    The descendant of the East-ancestor shows a West-lineage mutation, leading to a
    sequence identical to that of the West-1 x East-ancestor recombinant.

    MJ networks can be, but are not always, phylogenetic networks. That is, a box in a MJ network may reflect either of two different things:
    • homoplasy, ie. alternative evolutionary pathways
    • reticulation events.
    A Median-Joining network is not enough to study viruses

    In their "Significance" section, Forster et al. continue:
    The network method has been used in around 10,000 phylogenetic studies of diverse organisms, and is mostly known for reconstructing the prehistoric population movements of humans and for ecological studies, but is less commonly employed in the field of virology.
    However, using these networks is tricky, because they (like any parsimony method) struggle with homoplasy, and (like all tree inferences) they cannot handle recombinants. A virus MJ network provides a display of mutation sites in an evolutionary context that, in the presence of ancestor-descendant relationships, does better than a Consensus network of most-parsimonious trees; but it is not a phylogenetic network per se.

    Forster et al. provide free access to their data, but only as an RDF file, which is NETWORK's matrix format; and there is no data export option in the freeware version of the program. So, we cannot do any quick downstream investigation of the "published" dataset (and have to rely on our own harvest, as for the previous post, available via figshare).

    The reason, we can apply Median networks to complete CoV-2 genomes at all is their low divergence. From our previous post (sampled between December 2019 and March 1st 2020 with a focus on China and the USA), our Group 7 sequences (= SARS-CoV-2) show 146 mutation patterns, 141 site variations and five 3 to 15 nt-long deletions in a stretch covering ~29,700 of the up to 30,000 basepairs of 88 CoV-2-genomes (ends trimmed for missing data). There are also polymorphic base calls in the data, but no prior way to judge whether these represent genuine host polymorphism or simply mediocre sequencing.

    Are we detecting homoplasy, or is it recombination?

    Since the overall divergence is low, and we have nearly 30,000 basepairs (i.e. 10,000+ for synonymous substitutions underlying &plusm; neutral evolution), we can fairly rule out random homoplasy creating the network patterns. The chance that two independent virus lineages mutate the same position of a total of 30,000 by accident is low. Indeed, most SNPs and three of the deletions occur only in a single sequence, stochastically distributed across the genomes. So, we have:
    • 111 singletons: 94 SNPs, including one set of linked SNPs (6 SNPs, stretching across 50 nt), 13 possible intra-host polymorphisms (PIHP), and 4 deletions.
    • 35 parsimony-informative patterns: 34 SNPs, of which eight involve PIHP, and 1 deletion.
    We may still have homoplasy, even in the parsimony-informative sites, because some positions may be more susceptible to mutations than are others, and some mutations may be generally beneficial for the virus' spread. If the sample is large enough, then these should be easy to spot, because they should be frequent, and show character splits incompatible with the rest of the sequences.

    In our data, there are two candidates for homoplasy among the parsimony-informative patterns, both of them mutations from G or C in the reference and majority of genomes to U.

    Example 1

    At alignment position 11121, the majority G is replaced by U in nine genomes, and C in one. If we exclude recombination as a cause, then it represents a safe homoplasy because U-carrying genomes show rare additional mutations deviating from the consensus (which is identical to the reference genome, "Wuhan 1") also seen in G-carrying genomes. Those mutations can be located at the start, center or end of the genomes. In addition, we find one transversion at the G/U site. This could be indicative for the G → U/C site being a site that is subject to increased probability of mutation , and hence homoplasy.

    Genomes sharing rare mutations in addition to G/U variation at alignment position 11121. The first occurrence of the U-mutation, not accompanied by any other mutation, was discovered by Japanese researchers on the docked cruise ship. The thickness of the lines shows the number of genomes with identical mutation patterns in the parsimony-informative sites (1 pt = 1 genome), the size of the majority base, always found in the reference genome, its frequency (0.5 pt = 1 genome). The "jet setter" host is a Brazilian coming home from Switzerland via Italy.
    However, six of the nine accession are from the "Cruise A" sample, the early quarantined Diamond Princess. Given the setting (a closed, densely populated space) and usually diverse host populations on cruise ships, the otherwise unchanged CoV-2 U-strain (top) and already modified G-strains present in the ship's population may just have recombined: the sequences up- and down-stream of the G/UC-site can be identical in various CoV-2 lineages for hundreds of basepairs.

    Example 2

    An analogous situation is found for the other candidate position, alignment position 24072 (black arrow), where a C is replaced by U in four genomes. One genome (MN988713; from Illinois, USA, sampled Jan 21st) shows the polymorphism: Y (= C/U). In MN988713, 7 more of the 35 parsimony-informative SNPs are polymorphic: the sequence is a near-perfect (gray arrow) consensus of the original "Wuhan 1" type and a strongly derived type (probably Forster et al.'s A cluster) from a second Illinois host sampled a week later, Jan 28th (MT044257)

    Black and gray arrows highligh sites indicative for homoplasy or within-USA recombination. The polymorphic Illinois genome represents a strict consensus of the second Illinois strain (sampled one week later) — directly derived from the California strain, derived within the Type A cluster — and a (not sampled) sequence differing from the Wuhan 1 type (Type B) by one point mutation shared with two North American samples from end of January.

    If we assume that the lab didn't just mix up or cross-contaminate the IL1 and IL2 samples, then the MN988713 host was infected twice by the CoV-2 virus: once by the original strain (Forster et al.'s Type B), and a second time by an evolved strain, being the tip of a new CoV-2 lineage that can be traced back (by congruent mutation patterns) to Jan 10th, Shenzhen (Guangdong, China) characterized by two C → U transitions at alignment pos. 8820 and 28182 (Forster et al.'s Type A).

    Distinguishing homoplasy and recombination

    With a growing set of samples, and given that the virus is free to mutate further in a large amount of hosts, it might become easier and more straightforward to distinguish homoplasy from recombination. It is possible that incongruent character splits have not one but two reasons: they have evolved in parallel but also have been propagated by recombination. The U replacing a G or C (or A) at the same site in one accession reflects a different history from another accession. Homoplasy and recombination result in the same graph inferences.

    I agree with Forster et al. that the MJ network is under-used in virology (and other biological disciplines: eg. Why do we still use trees for the Neandertal genealogy; Using median networks to understand the evolution of genera) because it is a perfect tool — especially when used as a data-display network (eg. Networks can outperform PCA ordinations in phylogenetic analysis; Can we depict the evolution of highly conserved gene regions such as the ribosomal RNA genes). It facilitates grouping genotypes, to define ancestors and descendants, and to put them in a preliminary evolutionary framework.

    But it cannot replace investigating the sequence mutation patterns, especially when we want to look out for intra-host variation — that is, a patient carrying more than one virus strain (parsimony treats polymorphism as missing data) — and recombinants. Visual inspection and tabulation can do this, although it takes a lot more time (and space).

    Inferring a MJ network is Step 1. The obligatory Step 2 is to assess how conserved and/or phylogenetically informative are the reconstructed mutation patterns. This also can help to identify wrong roots inferred via outgroups. Forster et al.'s Type A is likely not the ancestral type, and the shared U-sites with the bat-virus outgroup are due to homoplasy, instead, as I will show in the next post (in two weeks's time).

    Data

    The complete tabulation of mutation patterns (EXCEL spread sheets) and the CoV-2-only alignment in ready-to-use NEXUS and (extended) PHYLIP format have been added to our figshare coronavirus data and file collection.

    Grimm G, Morrison D (2020) Harvest and phylogenetic network analysis of SARS virus genomes (CoV-1 and CoV-2). figshare. Dataset. https://doi.org/10.6084/m9.figshare.12046581.v2

    References

    Bandelt H-J, Forster P, Sykes BC, Richards MB (1995) Mitochondrial portraits of human populations using median networks. Genetics 141: 743–753.

    Bandelt H-J, Forster P, Röhl A (1999) Median-joining networks for inferring intraspecific phylogenies. Molecular Biology and Evolution 16: 37–48.

    ClonalFrameML: accounting for recombination in bacterial phylogenies

    Horizontal gene transfer in bacteria, mediated by transformation, transduction or conjugation, can result in gain, loss and replacement of genes. The replacement of horizontally transferred genes or gene fragments in a process known as homologous recombination has far-reaching effects on bacterial phylogenetics - the study of relatedness between bacteria. A new method published by Xavier Didelot and me last month in PLoS Computational Biology corrects for these distorting effects of homologous recombination on bacterial phylogenies.

    Two forms of phylogenetic distortion are caused by recombination. The first affects the shape of the tree topology. Although this is a potentially serious difficulty, Jessica Hedge and I recently showed that phylogenies estimated from whole bacterial genomes are surprisingly robust to this problem. The second affects the lengths of the branches. When genetic material is replaced by a homologous but distantly related sequence, it gives the appearance of a cluster of substitutions in the genome, and this can exaggerate branch lengths. ClonalFrameML detects these clusters of substitutions, identifies them as recombination events, and corrects the branch lengths of the tree.

    Correcting for recombination is important in a variety of settings. In transmission studies, recent transmission between patients can be detected by comparing the genomes of the infecting bacteria. As we show in the paper, ClonalFrameML improves detection of transmission events by accounting for the tendency of recombination to elevate the evolutionary distance between genomes. We also report the discovery of a remarkably large chromosomal replacement event spanning 310 kilobases that may have led to the evolution of the ST582 strain of Staphylococcus aureus, underlining the importance of recombination over short and long timescales.

    ClonalFrameML is a much faster implementation of the popular ClonalFrame method by Xavier and Daniel Falush. It is based on the same underlying assumptions and the same explicit evolutionary model, so it provides interpretable estimates of rates of recombination, the length of DNA imported by recombination, and the relative impact of recombination versus mutation. However, it can now analyse thousands of whole bacterial genomes in a matter of hours, representing a substantial improvement over the earlier method.

    New paper: bacterial phylogenetic inference is robust to recombination but demographic inference is not

    Published this week in mBio, Jessica Hedge's new paper "Bacterial phylogenetic inference is robust to recombination but demographic inference is not" looks at a long-standing problem: why are phylogenetic trees so popular in bacterial genomics when everyone knows recombination (which is detectable in most species studied) leads to seriously misleading inference? A burst of research activity in the early 2000s showed that homologous recombination - which can result from various forms of horizontal gene transfer in bacteria - can distort phylogenetic trees and lead to false inference of positive selection and demographic growth in methods that rely on them.

    In the intervening years there has been intense research in the field of population genetics into approaches that account for recombination, although the practically useful methods rely on approximations because of the inherent difficulties of learning about complex reticulated evolutionary networks that recombination generates. This has led many of my population genetics colleagues to regard - at least privately - the use of phylogenetic trees in recombining species as "bust", and the conclusions drawn from such studies as questionable. In this paper we show that this view is too simple.

    FIG 1 

    New paper: Mobile elements drive recombination hotspots in the core genome of Staphylococcus aureus

    This week published in Nature Communications we have a new open access paper looking at what drives variability in rates of recombination (horizontal gene transfer, HGT) in the core genome of Staphylococcus aureus. HGT in the core genome is important for eliminating harmful mutations and promoting the spread of beneficial mutations, such as those that make the bacteria resistant to antibiotics.

    Compared to recent work focusing on individual, highly-related strains of S. aureus, we found much higher rates of core HGT across the species as a whole. We saw that the frequency of HGT varies along the genome. At broad scales, core HGT is higher near the origin of replication, a pattern reminiscent of the one described by Eduardo Rocha and colleagues in E. coli, who hypothesized that the over-abundance of DNA near the origin during rapid growth could promote HGT.

    At fine scales, we found more frequent HGT in regions of the core genome close to mobile elements. The hottest regions occurred near mobile regions called ICE6013, SCC and genomic island α. The insertion and excision of mobile elements from the genome represents a type of HGT, so our finding that nearby core regions also experience more HGT suggests there is some sort of "spill over". This idea is supported by work in Ashley Robinson's group that found similarities between ICE6013 and a class of mobile elements in Streptococcus agalactiae called TnGBS2. TnGBS2 was discovered by Phillipe Glaser's lab who showed it sometimes transfers large tracts of adjacent core material during conjugation.

    Whether conjugation alone can explain the high levels of core HGT we saw in S. aureus is unclear - our results suggest there is detectable HGT even in core regions far from mobile elements. Transformation is another possible mechanism of core HGT, but S. aureus is generally thought to be naturally incapable of transformation. However, intriguing work published by Tarek Msadek and colleagues in 2012 indicates there may be cryptic mechanisms of transformation in S. aureus after all. It remains to be seen whether the relative contributions of transformation, transduction and conjugation to the long-term evolution of S. aureus can be disentangled.

    omegaMap at BioHPC

    All evolutionary biologists wishing to make use of omegaMap now have access to a high performance parallel computing cluster via the internet courtesy of Cornell's CBSU and Microsoft. The software, which allows the detection of selection and recombination in DNA or RNA sequences, can be run via the web interface at cbsuapps.tc.cornell.edu/omegamap.aspx, or downloaded as part of the BioHPC suite.

    The web interface consists of a simple form where users can upload their configuration file and sequences in FASTA format. Completed jobs are notified by e-mail. To learn more about the project visit the CBSU home page.

    Meanwhile, I am working on several major updates to omegaMap, the most interesting of which will probably be the development of a new model that allows for the joint analysis of natural selection acting on sequences from different populations or species. The aim is to integrate population genetic and phylogenetic models of selection in order to exploit the signal of selection contained both in polymorphism within populations (or species) and divergence between them. I will be presenting progress on this work, in the context of hominid evolution, at the 2009 SMBE meeting in Iowa City this June.

    Inferring niche membership from genetic diversity

    Each Wednesday the Ecology and Evolution department run a journal club called Noon Illumination, and this week I volunteered to lead discussion on a recent article titled Resource Partitioning and Sympatric Differentiation Among Closely Related Bacterioplankton (Science 320: 1081-5), by Dana Hunt and colleagues based at MIT and Ghent. I originally prepared the presentation for a Bacterial Metagenomics workshop in Berlin this July, organized by Daniel Falush.

    Of central interest in the paper is a novel methodology that infers habitat/niche based on ecological variables and DNA sequencing in the family of marine bacteria Vibrionaceae. That places it in the wider context of methods that attempt to predict phenotype (in this case niche) from genotype. Their approach is an elegant extension of familiar phylogenetic methods to model habitat switching over evolutionary time. Based on arguments put forward by Christophe Fraser and colleagues, the paper reasons that the ancestral habitat switches they detect are likely to be adaptive because the rate of recombination eclipses the mutation rate sufficiently to preclude the possibility of neutral genetic clustering.

    However the high rate of recombination raises some difficulties of interpretation. The principal phylogenetic reconstruction was based on the hsp60 gene, but by sequencing other housekeeping genes, Hunt and colleagues found that in some cases, recombination between genes caused an artefactual habitat switch in the hsp60 ancestry that was not evident in the other genes. Using a permutation test, I found evidence for recombination within the vibrio hsp60 genes, which may confound the phylogenetic reconstruction of evolutionary relationships (Schierup and Hein 2000). On a more philosophical note, suppose you could directly observe ancestral habitat switches. Would that be strong evidence for adaptation? An association between habitat and genetic lineage is probably not sufficient to demonstrate the action of natural selection. On the other hand, frequent recombination could empower genome-wide scans for extreme association between genes and habitats, that would provide stronger support for adaptation.

    You can view a PDF of the presentation of this stimulating article in our journal club here.