 If you’ve eaten at a restaurant lately, you might have noticed a substantially higher bill than you’re used to. You’d be right to assume that it’s because of things like inflation and pandemic-induced prices, but you might not realize how much the cost of ingredients, labor, and a new takeout business model has gone up for restaurants. Priya Krishna and Umi Syam, for The New York Times, redesigned a single receipt to show a more detailed breakdown.
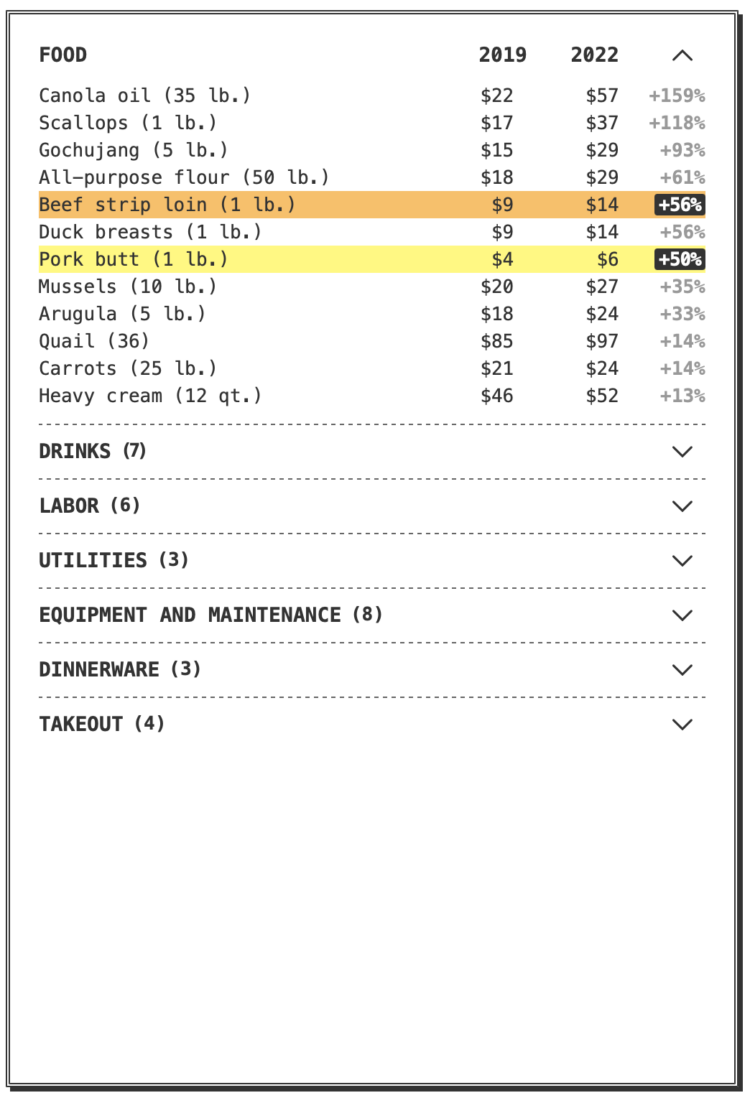
The receipt presentation and color-coded scrolling are tops. It’s a well-made table that works with the copy to highlight items.
Tags: inflation, New York Times, receipt, restaurant