Algorithmic road trip to visit a street named after each day of the year

Ben Ashforth set out to visit a street named after a day of the year for each date. He used OpenStreetMap to find the streets and then algorithmically routed a trip. Then he followed through and went on the trip. In a five-minute lightning talk, he describes the journey. See a photo for every day here. [via Waxy]

Tags: , , ,

Map of most common domesticated animals

Based on data from the USDA Census of Agriculture, this map by John Johnson shows the predominant domesticated animal in each county in the United States. It nonchalantly includes humans.

Tags: , ,

Local wanderlust

Alastair Humphreys, using a 20 by 20 kilometer map of where he lives, explored one square kilometer at a time as if he were traveling farther. For the Guardian:

Travelling around my unremarkable map for a year gave me much to remark on. It was one of the most interesting journeys of my life and shifted my perspective on the way we choose to travel. It made me calmer and healthier. It fostered feelings of curiosity, awe, gratitude and a deeper awareness of nature than I had experienced before. The more you look, the more you see. The more you see, the more you learn and care. Your local map is a fractal of the world at large. Embrace it, care for it, cherish it, and discover it. You might just find that a single map is enough exploration for an entire lifetime.

Tags: , ,

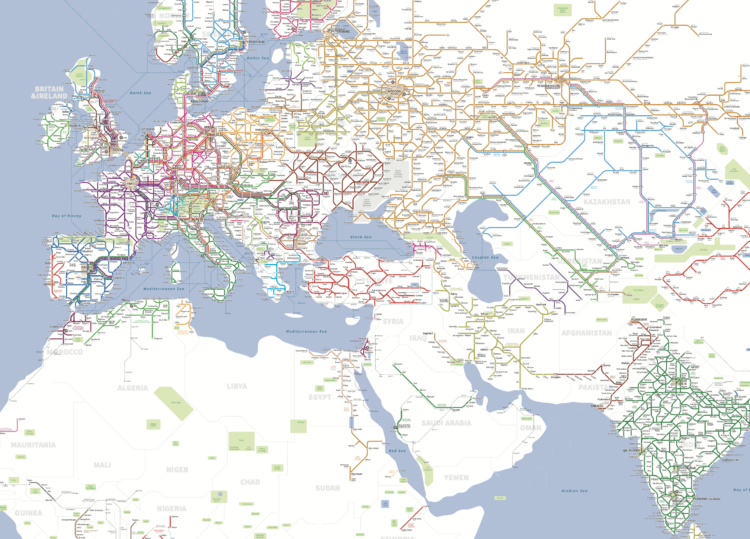
World railway map

Usually you see a railway map from a local perspective, because it’s meant to show how you get from point A to point B. As a learning experiment, Zhaoxu Sui mapped major railways worldwide. It’s not comprehensive but still interesting to think about, in case you’re trying to get to China from Europe by train.

You can grab the full PDF version here.

Tags: , ,

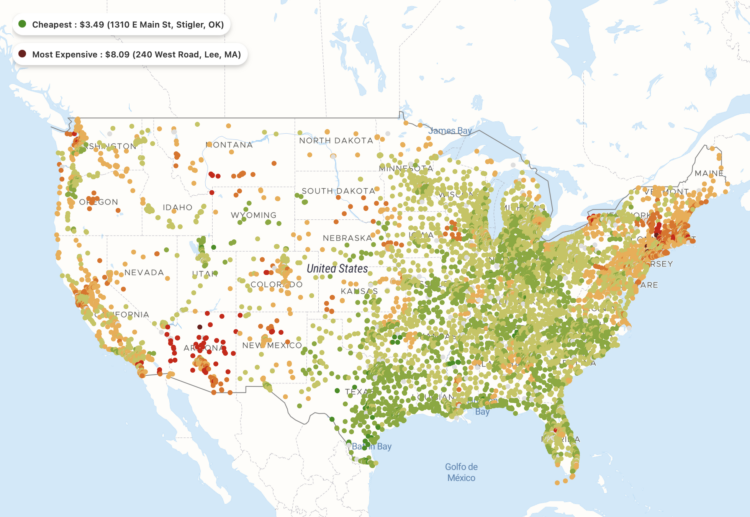
Cost of a Big Mac at every McDonald’s in the United States

A map, by Pantry & Larder, shows the cost of a Big Mac at each McDonald’s in the United States, as of early 2023. As you might expect, the prices are higher on the east and west coasts. The most expensive Big Mac was in Lee, Massachusetts for $8.09. I assume shipping to Hawaii and Alaska brings prices up in those states.

But what’s going on in Montana and Arizona? Based on Regional Price Parity, Montana tends to cost less compared to the national average, and Arizona is right in the middle. Then again, when you adjust for cost of living, the two states are right next to each towards the bottom for income, so I guess it makes sense.

Tags: , ,

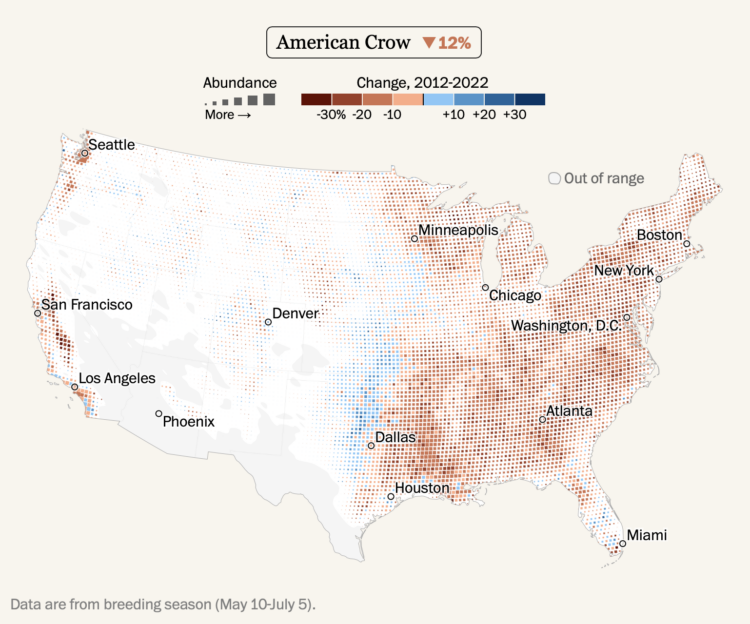
Shifting bird populations

Using data from the crowdsourced database eBird, Harry Stevens mapped the shifts in bird populations for the Washington Post. Increased building and climate change have led to population declines for many species over the past decade, but some species, such as the blue jay, have seen growth.

Be sure to check out the interactive at the end that lets you search the full species list.

Diligent birders log data on eBird, which they can use to keep track of their own observations. Collectively, researchers can then generate reliable models with the data. The scale of this project continues to amaze.

Tags: , , ,

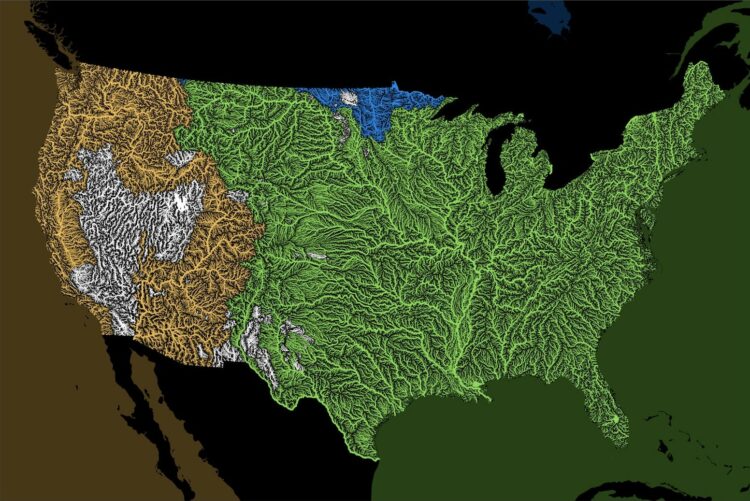
Oceans that all the rivers drain

Rivers drain into oceans. Grasshopper Geography color-coded the rivers in the world by the ocean they drain into and made a series of maps.

But what is an ocean drainage basin map, I hear most of you asking? A couple of years ago I tried to find a map that shows in which ocean does each of the world’s rivers end up. I was a bit surprised to see there is no map like that, so I just decided I’ll make it myself – as usual. Well, after realizing all the technical difficulties, I wasn’t so surprised any more that it didn’t exist.

It reminds me of the map that shows where a raindrop ends up.

Tags: , , ,

Where restaurants serve Asian cuisines in the U.S.

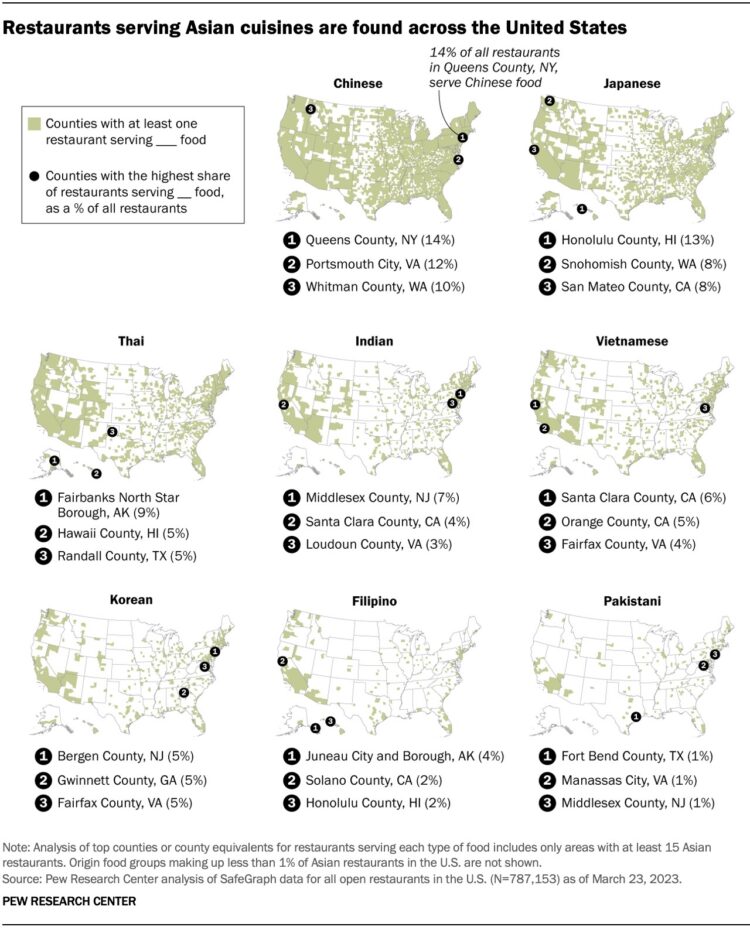
You can find Asian restaurants in most places in the United States, but the type of Asian food choices varies. For Pew Research, Sona Shah and Regina Widjaya mapped the distributions of eight major cuisines.

Whenever I’m in a new place, I like to check out the Chinese restaurants, because they’re everywhere. It’s fun to taste the area’s version of universal Chinese dishes. I’ve been to Queens. Now I’m curious about Portsmouth City and Whitman.

Tags: , ,

Where it warmed the most in the world

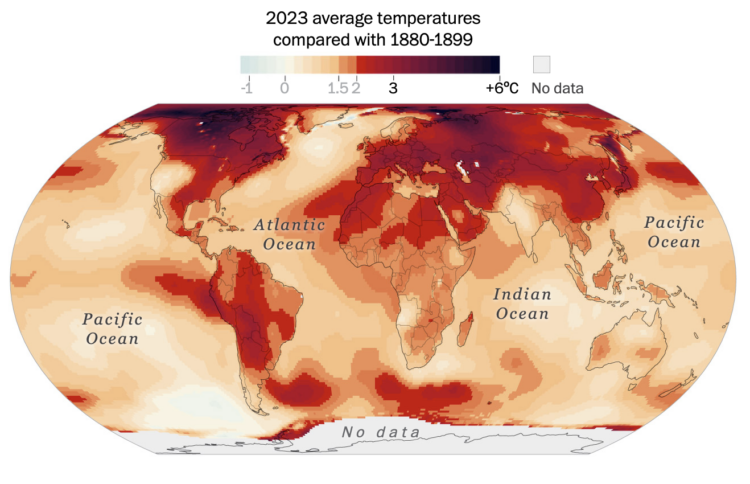
Earth got its hottest year on record in 2023. Based on data from Berkeley Earth, John Muyskens and Niko Kommenda, for The Washington Post, focused on the geographic areas that experienced the biggest jumps.

The Post has mapped the regions that saw the largest temperature anomalies in 2023 — places that have warmed so fast that the climate is already testing the limits of human infrastructure and the ability of the natural world to cope.

Tags: , ,

Snow drought

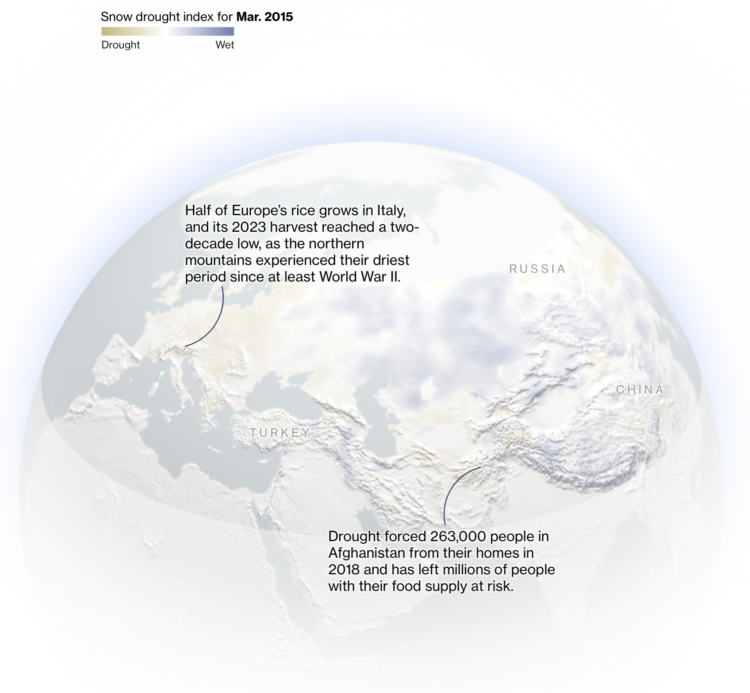
A warming climate has meant less snow in the northern hemisphere, which is a problem when agriculture depends on melting snow to grow crops. Bloomberg reports on the current snow drought situation.

Tags: , , ,