For The Pudding, Lars Verspohl provides an introduction to statistical models disguised as a lesson on finding good wine. Start with a definition of wine, which becomes a way to describe it with the numbers. Define what makes a wine good. Find the wines that look closer to that definition.
Category Archives: wine
Posted by in Modeling, Pudding, statistics, wine
Grape harvest dates as proxies for global warming
Phenological patterns are often highly correlated with temperatures. As noted by Chuine et al. (2004):
Biological and documentary proxy records have been widely used to reconstruct temperature variations to assess the exceptional character of recent climate fluctuations. Grape-harvest dates, which are tightly related to temperature, have been recorded locally for centuries in many European countries. These dates may therefore provide one of the longest uninterrupted series of regional temperature anomalies (highs and lows).Harvest dates of grapes in western Europe (used for wine-making) are of especial interest because they constitute long phenological records, as a result of the fact that the harvest dates are usually officially decreed, based on the ripeness of the grapes. In other words, we have historical records for many locations over many years.
Daux et al. (2012) have compiled many of these records into a publicly accessible database archived at the World Data Center for Paleoclimatology.
This database comprises time series for 380 locations, mainly from France (93% of the data) as well as from Germany, Switzerland, Italy, Spain and Luxemburg. The series have variable lengths up to 479 years, with the oldest harvest date being for 1354 CE in Burgundy. The series are grouped into 27 regions "according to their location, to geomorphological and geological criteria, and to past and present grape varieties." These regions are shown in the map.
Normally, such data would simply be graphed as a time series for each region. However, as usual in this blog, we can examine these data using a phylogenetic network, to perform an exploratory data analysis. However, most of the data are actually "missing", because most of the time series have time gaps or cover only short periods. So, to create a more complete dataset I have extracted the data for the years 1800-1880, inclusive, because for this period 17 of the regions have mostly a complete series.
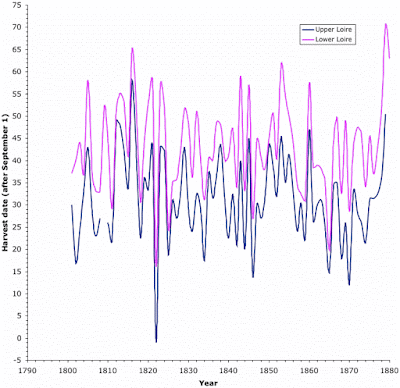
Two of the time series are shown in the first graph. This shows that the two time series are highly correlated, as are most of them. In this case, the correlation coefficient is 0.87.
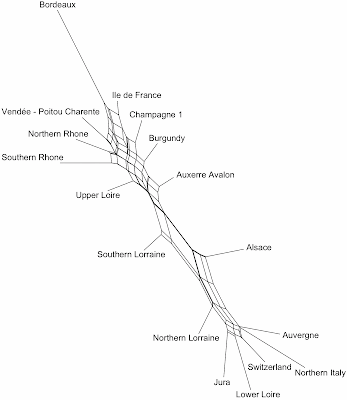
I then used the gower distance to calculate the similarity of the different years and regions, based on the harvest dates (the gower measure is needed in order to deal with the fact that some of the data are still missing). This was followed by a neighbor-net analysis to display the between-region and the between-year similarities as two phylogenetic networks.
Only the first network is shown here. Regions that are closely connected in the network are similar to each other based on the variation in their harvest dates through time, and those that are further apart are progressively more different from each other.
Many of the patterns here are to be expected, based on the geographical proximities of the regions, but some are not. For example, Ile de France, Champagne and Vendée - Poitou Charente are all in northern France (see the map) while Bordeaux is in the south-west, and the Rhone Valley regions are in the south-east. As Le Roy Ladurie & Baulant (1980) have noted, the vineyards of northern and central France are in a different climatic zone from the wine regions of southern France (to the south of the Geneva parallel) and those of western France (west of the Chateau-du-Loire meridian).
Similarly, at the other end of the network, the Lower Loire region is not geographically located near any of the associated regions in the network. Possibly the most unexpected pattern, then, is the network separation of the Upper and Lower regions of the Loire Valley, which are the two regions whose time series are graphed above.
Clearly, the network is displaying only quite small differences between the time series. That is, the time patterns are very consistent across the regions, which does indeed make them useful for studying past temperature patterns.
References
Isabel Chuine, Pascal Yiou, Nicolas Viovy, Bernard Seguin, Valérie Daux, Emmanuel Le Roy Ladurie (2004) Grape ripening as a past climate indicator. Nature 432: 289-290.
V. Daux, I. Garcia de Cortazar-Atauri, P. Yiou, I. Chuine, E. Garnier, E. Le Roy Ladurie, O. Mestre, J. Tardaguila (2012) An open-database of grape harvest dates for climate research: data description and quality assessment. Climate of the Past 8: 1403-1418.
Emmanuel Le Roy Ladurie and Micheline Baulant (1980) Grape harvests from the fifteenth through the nineteenth centuries. Journal of Interdisciplinary History 10: 839-849.
Choosing wines based on their labels
In this blog, we have occasionally used networks to illustrate differences between countries in some socially determined characteristic. This is a form of exploratory data analysis. Today's example concerns which characteristics of the label are used when choosing a bottle of wine for purchase.
The data are for a 12-country survey co-ordinated by:
Steve Goodman (2009) An international comparison of retail consumer wine choice. International Journal of Wine Business Research 21: 41-49.The data were collected using different techniques in each country — some data were collected online, others as mall intercepts, in-store surveys or various combinations. However, in each case the people were asked to rank the following 13 characteristics in order of importance for choice "the last time you bought a bottle of wine in a shop to have for dinner with friends":
- Tasted the wine previously
- Someone recommended it
- I read about it
- Origin of the wine
- Grape variety
- Brand name
- Matching food
- Medal or award
- Information on back label
- An attractive front label
- Information on the shelf
- Promotional display in store
- Alcohol level below 13%
For the exploratory data analysis, I first used the manhattan distance to calculate the similarity of the different countries and label characteristics, based on their choice scores. This was followed by a neighbor-net analysis to display the between-country and the between-characteristic similarities as separate phylogenetic networks.
The network for the 12 countries is shown in the first graph. Countries that are closely connected in the network are similar to each other based on the choice of label characteristics, and those that are further apart are progressively more different from each other.
Clearly, there are no strong groupings of countries, indicating that the people all do things differently. Nevertheless, there are some patterns here.
Some of the country associations are to be expected, based on the similarities of their cultures, such as the grouping of Australia, New Zealand and the USA. However, it might be expected that the other English-speaking country, the UK, would be in the same group, rather than where it is, associated with the two Asian countries, China and Taiwan. Similarly, it might be expected that France would be associated with the other mainland European countries, Austria, Germany and Italy, but this association is only weak.
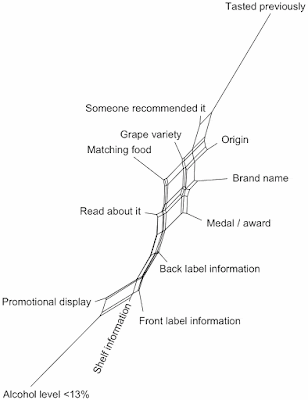
The source of these patterns becomes clear when we consider which wine-label characteristics were used to make the purchase choice. These are shown in the next network where, once again, characteristics that are closely connected in the network are similar to each other based on their ranking across countries, and those that are further apart are progressively more different from each other.
The characteristics that were consistently ranked highest are at the top-right of the network, progressing down to those ranked lowest, shown at the bottom of the network. Note that the label and its detailed contents are grouped at the bottom, along with shelf and promotional information. The rumor that a "nice label" is an important component of choice is not supported by these data. As the author notes: "it does appear that in-the-store / point-of-purchase / nice-labels information might in fact be too late to influence decisions" — people more often make their choice before they get to the store.
Instead, the contents of the bottle and its origin rank high, along with previous experience (awards and recommendations); but, not unexpectedly, nothing beats personal experience with the wine. One's own prior opinion is more important than anything else.
The somewhat unexpected location of France in the network arises because the French ranked "Matching food" as their top criterion, whereas most other people chose "Tasted the wine previously". However, for Italy it was a close-run thing between these two choices, making the Italians the closest to the French.
The unexpected location of the UK in the network arises because these three were the only countries where "Grape variety" was a long way down the choice list. This might be related to the fact that the British have long been wine consumers, back in the days when grape varieties were not prominently displayed on wine labels, unlike the situation for the "new world" wine consumers, where it is often the most prominent piece of information. However, traditional lack of interest in grape varieties would also apply to the other European countries.
Interestingly, China and Taiwan also put "Matching food" a long way down their lists, as did the New Zealanders, whereas Australia, the UK and the USA put "Matches food" near the middle of their lists. Thus, only half of the countries thought that this criterion, which is traditionally considered to be important, was of much interest. Anyone who has ever tried drinking a wine whose taste does not complement the accompanying food (as I sadly have) will thus think that half the world is crazy. Perhaps these people are not drinking their wine with a meal? Philistines!
A century of French wine vintages
It has been quite some time since I have produced a network-based exploratory data analysis (EDA) of some multivariate dataset, so it could be time to do so again.
In the wine industry, it is common to provide quality scores for the different vintages from particular wine-producing regions. These so-called vintage charts are intended to tell us how the harvest quality has varied from vintage to vintage. They are often disparaged, because they simplify the complexities of each harvest (where there can be considerable spatial variation) down into a single number. They also make little sense if a single number is applied to a very large area, which often occurs in practice.
Nevertheless, they can be an interesting and informative guide to the general features of each vintage, especially if they cover a long period of time.
My interest in this concept comes from the fact that I have recently started a blog about wine: The Wine Gourd. In the interests of doing something different to every other wine blogger, this blog delves into the world of wine data, instead of the usual reviews of recently released wines. The intention is to ferret out some of the interesting stuff, and to bring it out into the light, for everyone to see. Hopefully, this will be both interesting and informative.
French wine vintages
The Cavus Vinifera web site has produced vintage charts for several of the wine-producing regions of France, from the year 1900 to the present. This is very unusual, as most vintage charts cover a much shorter period of time. This circumstance thus provides the opportunity to compare these French regions over the past century, to investigate to what extent vintage variation is correlated among these areas.
Each vintage from 1900-2014 has been rated on a scale of 0-20. The region and wines covered by the entire time span include:
Région de Bordeaux (rouge)
Région de Bordeaux (blanc)
Région de Bordeaux (liquoreux)
Région de la Bourgogne (rouge)
Région de la Bourgogne (blanc)
Région du Rhône (Nord)
Région du Rhône (Sud)
Région du Loire (rouge)
Région de la Champagne
Région du Beaujolais
As usual, we can use a phylogenetic network to visualize these data, with the network being used as a form of exploratory data analysis. I first used the manhattan distance to calculate the similarity of the different years and regions, based on the quality scores. This was followed by a neighbor-net analysis to display the between-region and the between-year similarities as two phylogenetic networks.
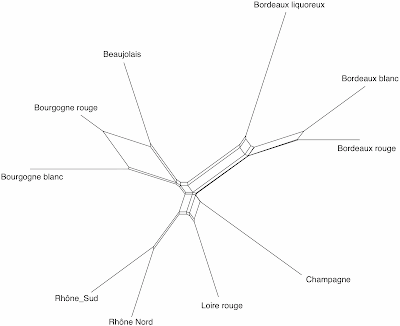
The network for the ten regions is shown in the first graph. Regions that are closely connected in the network are similar to each other based on the variation in their vintage quality scores through time, and those that are further apart are progressively more different from each other.
Not unexpectedly, the different wines from the same regions form neighborhoods: the three wines types from Bordeaux (in south-western France); the three wines from Burgundy and Beaujolais (along the Saône River in eastern France); and the two wines from the Rhône River (in the south-east). However, unexpectedly, the Loire wine, from western France, is associated with the Rhône wines, while the Champagne region, in northern France, is somewhat isolated.
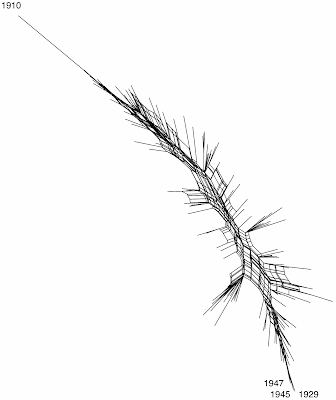
The network for the 115 years is shown in the second graph. In this case, years that are closely connected in the network are similar to each other based on the vintage quality scores averaged across all of the regions, and those that are further apart are progressively more different from each other.
Here, the years form a gradient from the poorest-quality years, at the top, to the best-quality vintages at the bottom. Only four of the vintages are labeled, but the vintages at the top of the network include 1902, 1910, 1913, 1930, 1931, and 1968. The vintages at the bottom of the graph include: 1929, 1945 and 1947, followed by 1928, 1949, 1989 and 1990, and then 1906, 1953, 1959, 1961 and 2005.
Note that the 1930s were generally not a good time for wine-making in France, and nor were the 1910s (although 1906 was an early century exception). The 1940s and 1950s, on the other hand, were generally good times for wine production.
The 1910 vintage stands out as particularly poor, with none of the regions scoring more than 10 out of 20 for their grape harvest, and both Burgundy wines scoring 0. This contrasts with the best years, where no region scored less than 16 out of 20.
Needless to say, the years stacked in the middle of the graph were variable, with some regions having a good time in a particular year and some having a bad time in that same year. This is the normal state of affairs.
Always be wary of eBay
For regular blog readers, I should point out that this post is not about networks. It is interesting, nonetheless.
I have been known to occasionally buy wine on eBay. Wine cannot be advertised for sale on the English-language eBay sites without a liquor license (e.g. U.S.A., U.K., Australia, Canada, Ireland). However, it can be sold privately on many of the European sites (eg. Austria, Belgium, France, Germany, Italy, Netherlands, Spain), except to minors, and the wine can then easily be sent anywhere within the European Union. Indeed, many wine shops use eBay as their online portal.
This is generally a useful thing, because older vintage wines are widely available, usually much cheaper than in wine shops, although the buyer must beware. (In eBay terms, for older wines you are formally buying the bottle, not its contents.) I have purchased some very nice wines from 1950-1990 this way, although I have also had a few rather mediocre ones.
I have not yet been ripped off. Indeed, eBay prides itself on dealing with shonky activities by its members, although these activities still exist, and will presumably continue to do so. Recently, I encountered the following example, which I explain here for your education.
A Milan-based seller recently became active selling old vintages of Barolo wine. This in itself is not unusual, but what attracted my attention was that the seller was offering free shipping, apparently worldwide. That is very unusual, because international shipping costs from Italy are often more expensive than the wine itself. How could the seller afford this? Buyer beware! So, I decided to keep a curious eye on several of the wines. When I did so, an unusual bidding pattern appeared.
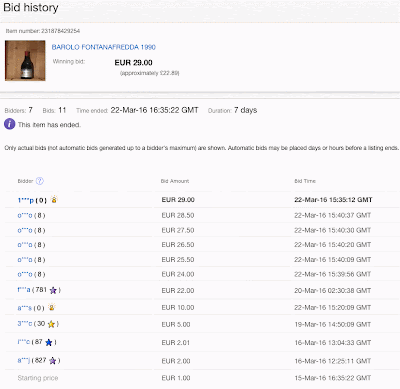
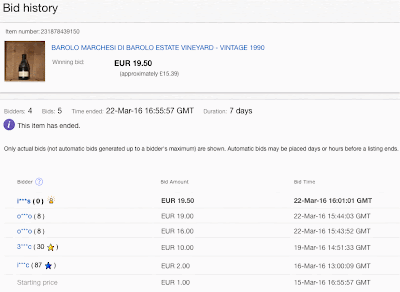
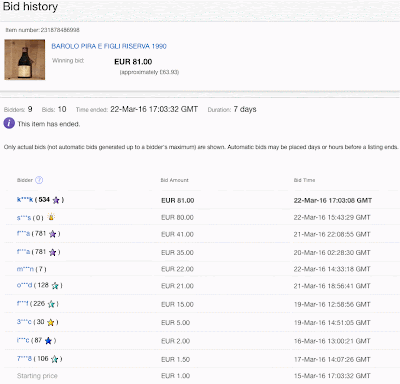
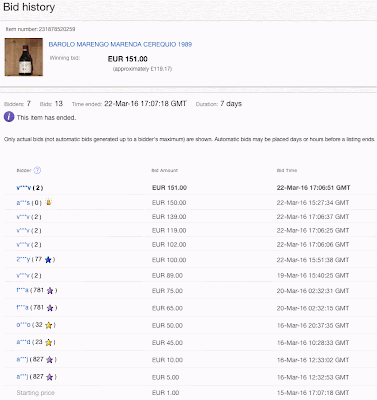
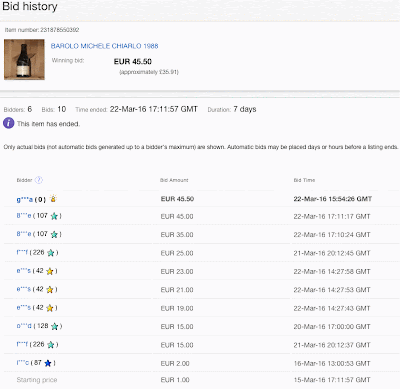
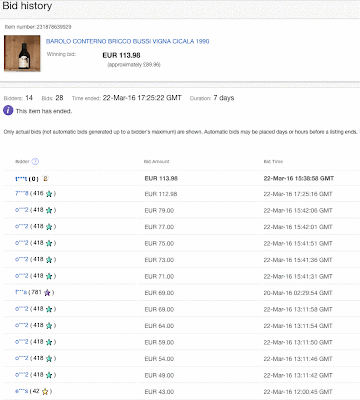
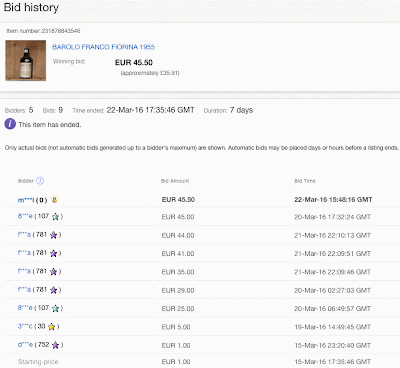
I have attached at the bottom of this post images of the final bidding results for all seven of the wines that I followed. Many more wines were offered by the seller, but I have not checked their results. You will note that in all seven cases a previously unknown bidder (ie. one who had never bought anything on eBay before) put in a snipe bid (ie. a bid during the last few seconds of the auction). In six of the seven cases this newbie bidder won the auction.
This is a quite unbelievable coincidence, and I do not for one moment believe it. I occasionally see newbies bidding high prices on wine, but not seven different newbies bidding on all seven of wines that I am watching. If you are prepared to accept this, then I have this bridge in Brooklyn that I would like to sell you ...
Indeed, this looks exactly like shill bidding — defined as "bids on an item with the intent to artificially increase its price or desirability." Normally, the shill bidder does not win the item, but merely forces the other bidders into bidding artificially high, preferably by forcing them to their maximum possible bid. This happened for one of the seven auctions shown below (the fourth one), in which an inexperienced bidder paid €151 for a wine that no-one else thought was worth more than €100. So, the shill bidder managed to extract an extra €50 of profit from the auction.
The other six auctions require a somewhat different explanation for their profitability.
Unfortunately, eBay has a mechanism that allows shill bidders to ostensibly "win" the item while still achieving their purpose of forcing another buyer to pay more for the item than they needed to. This is called a Second Chance Offer. After the auction, the highest losing bidder is contacted by the seller and told that they have another chance to buy the item, by paying their maximum bid amount. That is, the purpose of the shill bidding is to reveal the maximum bid — in an auction, normally the maximum bid for the highest bidder is not revealed, only the fact that they bid higher than everyone else (while every else's maximum bid is revealed).
Let's take one example from below, the sixth one. The highest bid is the shill bid (from bidder t***t), which was more than €114 — we do not know the actual bid, but one of the other examples (the fourth one) suggests that it was most likely €150. The second highest bid was €112.98 (from genuine bidder 7***8), and the third highest was €79 (from genuine bidder o***2). This means that, without the shill bid, the item would have sold for €79.50 to bidder 7***8. Instead, a Second Chance Offer is sent to 7***8 for sale of the item at €112.98, with a handsome extra profit of €33 to the seller (in collaboration with the shill bidder, who may or may not actually be a separate person).
Caveat emptor. Be very wary of Second Chance Offers on eBay. If you want to play safe, ignore them.
Always be wary of eBay
For regular blog readers, I should point out that this post is not about networks. It is interesting, nonetheless.
I have been known to occasionally buy wine on eBay. Wine cannot be advertised for sale on the English-language eBay sites without a liquor license (e.g. U.S.A., U.K., Australia, Canada, Ireland). However, it can be sold privately on many of the mainland European sites (eg. Austria, Belgium, France, Germany, Italy, Netherlands, Spain), except to minors — the wine can then easily be sent anywhere within the European Union. Indeed, many wine shops use eBay as one of their online portals.
This is generally a useful thing, because older vintage wines are widely available, usually much cheaper than in wine shops, although the buyer must beware. (In eBay terms, for older wines you are formally buying the bottle, not its contents.) I have purchased some very nice wines from 1950-1990 this way, although I have also had a few rather mediocre ones.
I have not yet been ripped off. Indeed, eBay prides itself on dealing with shonky activities by its members, although these activities still exist, and will presumably continue to do so. Recently, I encountered the following example, which I explain here for your education.
A Milan-based seller recently became active selling old vintages of Barolo wine. This in itself is not unusual, but what attracted my attention was that the seller was offering free shipping, apparently worldwide. That is very unusual, because international shipping costs from Italy are often more expensive than the wine itself. How could the seller afford this? Buyer beware! So, I decided to keep a curious eye on several of the wines. When I did so, an unusual bidding pattern appeared.
I have attached at the bottom of this post images of the final bidding results for all seven of the wines that I followed. Many more wines were offered by the seller, but I have not checked their results. You will note that in all seven cases a previously unknown bidder (ie. one who had never bought anything on eBay before) put in a late bid. In six of the seven cases this newbie bidder won the auction.
This is a quite unbelievable coincidence, and I do not for one moment believe it. I occasionally see newbies bidding high prices on wine, but not seven different newbies bidding on all seven of wines that I am watching. If you are prepared to accept this, then I have this bridge in Brooklyn that I would like to sell you ...
Indeed, this looks exactly like shill bidding — defined as "bids on an item with the intent to artificially increase its price or desirability." Normally, the shill bidder does not win the item, but merely forces the other bidders into bidding artificially high, preferably by forcing them to their maximum possible bid. This happened for one of the seven auctions shown below (the fourth one), in which an inexperienced bidder paid €151 for a wine that no-one else thought was worth more than €100. So, the shill bidder managed to extract an extra €50 of profit from the auction.
The other six auctions require a somewhat different explanation for their profitability.
Unfortunately, eBay has a mechanism that allows shill bidders to ostensibly "win" the item while still achieving their purpose of forcing another buyer to pay more for the item than they needed to. This is called a Second Chance Offer. After the auction, the highest losing bidder is contacted by the seller and told that they have another chance to buy the item, by paying their maximum bid amount. That is, the purpose of the shill bidding is to reveal the maximum bid — in an auction, normally the maximum bid for the highest bidder is not revealed, only the fact that they bid higher than everyone else (while every else's maximum bid is revealed).
Let's take one example from below, the sixth one. The highest bid is the shill bid (from bidder t***t), which was more than €114 — we do not know the actual bid, but one of the other examples (the fourth one) suggests that it was most likely €150. The second highest bid was €112.98 (from genuine bidder 7***8), and the third highest was €79 (from genuine bidder o***2). This means that, without the shill bid, the item would have sold for €79.50 to bidder 7***8. Instead, a Second Chance Offer is sent to 7***8 for sale of the item at €112.98, with a handsome extra profit of €33 to the seller (in collaboration with the shill bidder, who may or may not actually be a separate person).
Note that this approach to shill bidding does also deal with snipe bidders (ie. those who bid during the last few seconds of the auction — there are some examples below). Snipe bidding is sometimes considered to be immune to the actions of shill bidding (eg. How to snipe a winning bid), whereas in eBay this is not so.
Caveat emptor. Be very wary of Second Chance Offers on eBay. If you want to play safe, ignore them.
How did I miss this? The botrytized wine microbiome … from #UCDavis colleague David Mills
 |
| From here. |
Posted by in Bacteria, fermentation, UC Davis, wine


