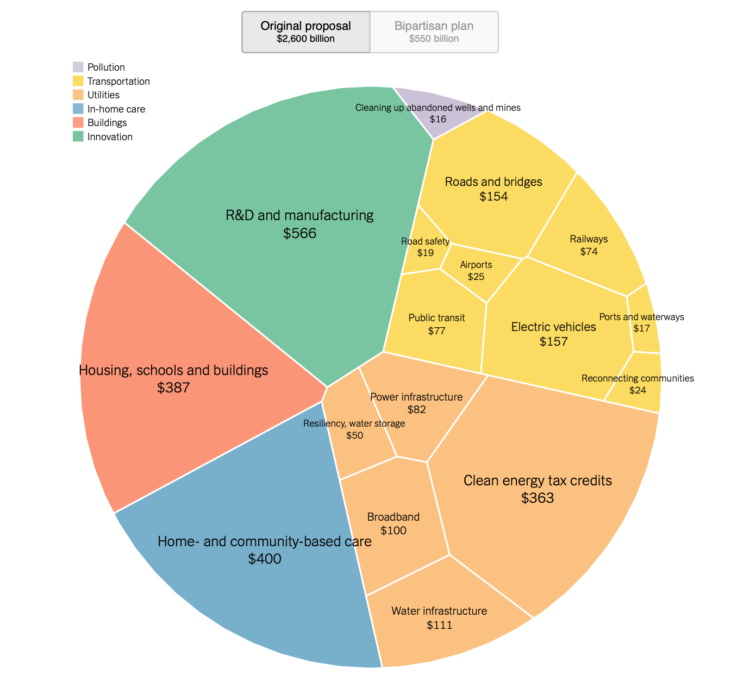
Comparison of Biden infrastructure plan and updated bipartisan plan

Aatish Bhatia and Quoctrung Bui for NYT’s The Upshot made the comparison using a circular Voronoi treemap. The fills flip between the original plan from March and the recently proposed plan, which is much smaller.

It takes me back to Amanda Cox’s consumer spending graphic from 2008, which no longer works, because Flash.

Tags: , ,

New Lab Matters: Making data fly

Cover of Fall 2019 issue of Lab Matters magazine illustrating high volume of data

In today’s technology-connected world, information moves quickly. But in the world of public health, pathogens often travel faster than the data needed to diagnose, treat and prevent illness. Reporting delays and incomplete or incompatible data delay insights into pressing public health problems. The solution? Investing in public health infrastructure and resources to rapidly deliver data to public health and clinical decision makers.

Here are a few of this issue’s highlights:

Read the full issue.

Subscribe and get Lab Matters delivered to your inbox, or read Lab Matters on your mobile device.

The post New Lab Matters: Making data fly appeared first on APHL Lab Blog.

American infrastructure mapped

I can always find time to enjoy me some minimal maps. Tim Meko for The Washington Post visualized American infrastructure in a series of six maps, from the electric grid to bridges and railroads. The above is pipelines.

Tags: ,