Choosing fonts for your charts

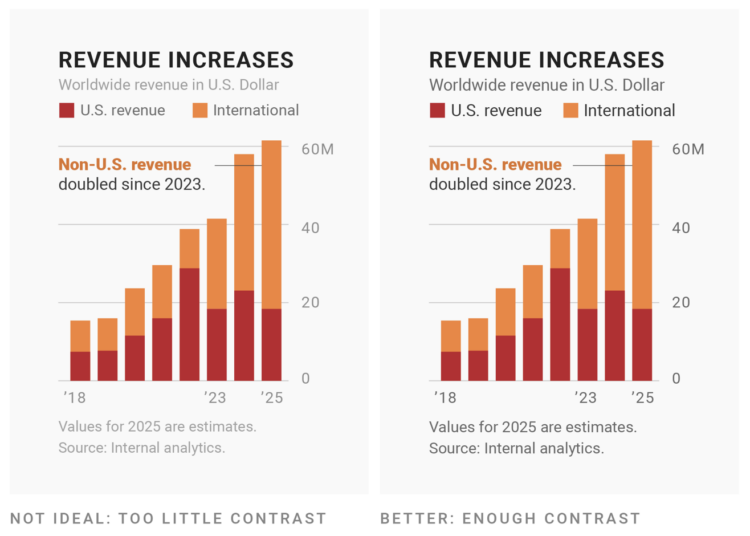
Changing the fonts you use for labels and annotation is one of the easiest ways to make charts more readable and less messy, which makes a chart more inviting to examine. For Datawrapper, Lisa Charlotte Muth discusses font choices and what to look for.

Can’t go wrong with another one of Muth’s clear and practical guides.

Tags: ,

Mapping extreme heat

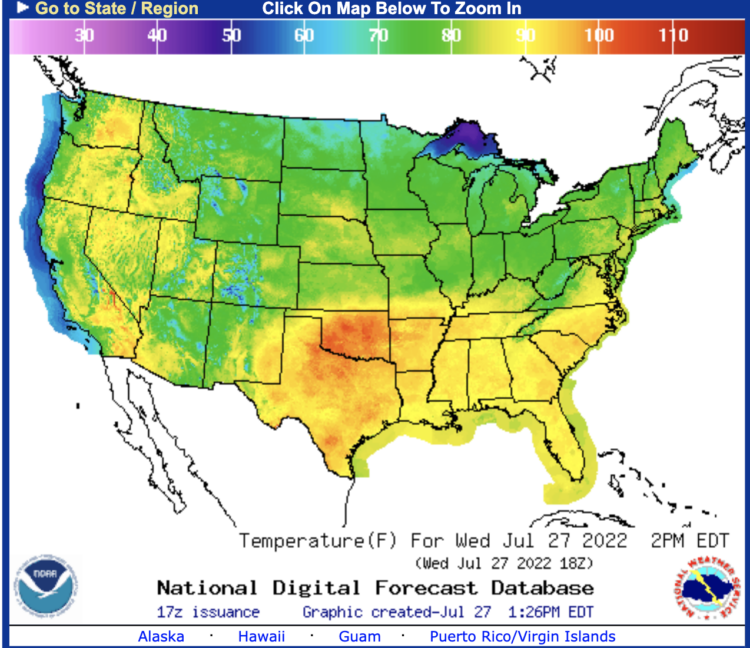
For Bloomberg, Marie Patino reports on the shifting design choices for mapping weather extremes. The rainbow color scheme and sunny icons aren’t cutting it anymore.

Tags: , , ,

Defining color palettes for all your charts

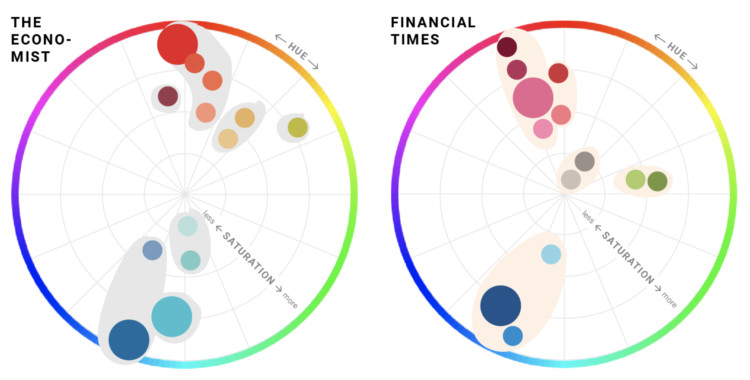
Selecting a color palette for a single chart can be tricky, which is why we see so many charts that just go with defaults. Selecting a color palette for all your charts is a bigger challenge. For Datawrapper, Lisa Charlotte Muth has you covered with a detailed guide that describes the important bits, existing color palettes in the wild, and consideration for your readers.

You’ll want to save this for later. It just stops short of picking the colors for you.

Tags: , , ,

Writing about probability in a way that people will understand

We see probabilities mentioned in the news, in weather forecasts, during sporting events, political arguments, business reports, elections, medical advice, and scientific findings. But probability is a tricky concept that not all (most?) people understand. Grace Huckins for The Open Notebook outlines useful ways to communicate the numbers more clearly — to increase the chances readers do understand.

On using concrete numbers over percentages:

Concrete numbers can also make statistics feel more personally relevant. A 0.5 percent risk of developing a particular kind of cancer may seem minuscule. But if a reader went to a high school with 1,000 students, they may find it more impactful to hear that five of their classmates, on average, will develop the disease. In a March 2021 story, American Public Media used concrete numbers rather than percentages to communicate race disparities in COVID deaths. They reported that 1 of every 390 Indigenous Americans had died of COVID.

Other tips include using visuals, relatable comparisons, and acknowledging uncertainty instead of speaking in absolutes.

Tags:

Visualization accessibility

Øystein Moseng for Highcharts provides a brief guide on making your visualizations for accessible. Guideline #4 on not relying completely on color to show the data:

Relying on color as the only means of communicating information is a failure of one of the basic WCAG success criteria. This is because many users may not be able to distinguish between the different colors used.

Data labels, symbols, annotations and tooltips are some common ways to convey additional information in visualizations without relying on color. In addition, alternate presentations – such as an accessible data table – can be helpful. It is still encouraged to use color as a supplement to these techniques, this can make visualizations easier to understand, and in many cases more accessible.

Tags:

Varying colors of state guidance maps

Many states use color to represent levels of Covid-19 and/or county restrictions. The color scales states use vary across the country. For The New York Times, Caity Weaver details the usage and the challenges of picking meaningful scales.

Tags: , , ,

Which color scale to use for your charts

On a superficial level, color scale selection seems like a straightforward task. Pick a sequence of colors that looks like it goes from light to dark. Done. But right when you get into it, you might find the process isn’t so straightforward. Different color scales can represent different aspects of your data, and poor selection can lead to poor communication. So, Lisa Charlotte Rost for Datawrapper wrote a four-part practical guide to help you figure it out.

See also Rost’s equally useful guide on what colors to pick for your scales.

Tags: , ,

Large collection of optical illusions and visual phenomena

Sometimes our eyes play tricks on us. Even when we know what is actually happening, our visual system won’t let us see the reality. Michael Bach has an extensive collection of 141 optical illusions, along with explanations of what’s tripping up:

Optical illusion sounds derogative, as if exposing a malfunction of the visual system. Rather, I view these phenomena as highlighting particular good adaptations of our visual system to experience with standard viewing situations. These experiences are based on normal visual conditions, and thus under unusual contexts can lead to inappropriate interpretations of a visual scene (=”Bayesian interpretation of perception”).

Tags:

Election map design challenges

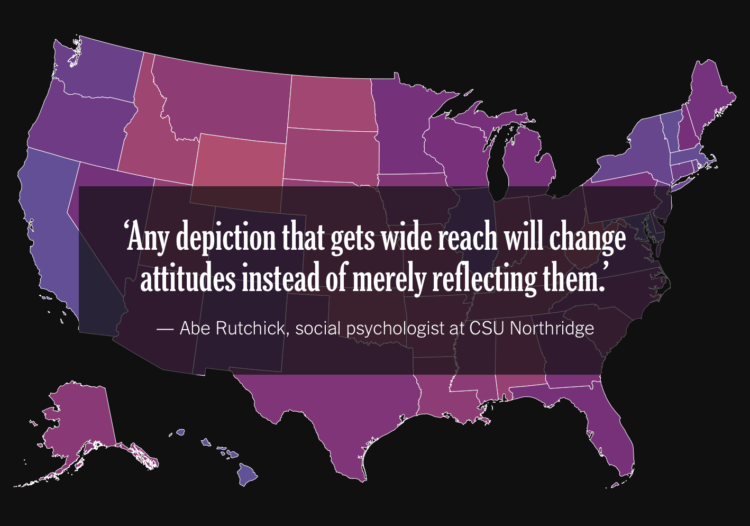
For NYT Opinion, Betsy Mason outlines the design challenges behind election maps. Do you show geography? Do you focus on scale? What colors should you use? For every choice, there’s always tradeoffs, which is why there are so many views.

Tags: , , ,