✚ How to Make UpSet Plots in R, with ggplot2 and ggupset

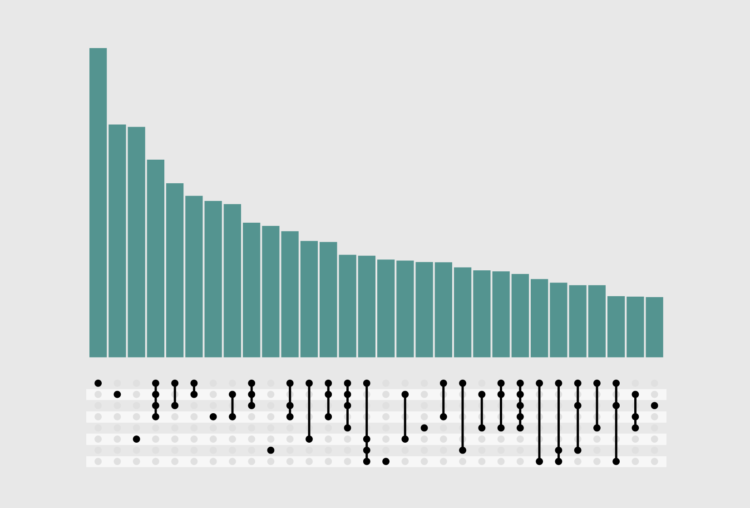
In addition to a great format for visual jokes, Venn diagrams can clearly show overlap between sets. Sets, as in set theory, can be understood as objects belonging to one or more collections. The classic examples in mathematics are natural numbers, integers, rational and real numbers. But sets are everywhere.

Become a member for access to this — plus tutorials, courses, and guides.

✚ How to Make Print-ready Graphics in R, with ggplot2

ggplot2 provides sensible default settings for analysis, but when you make charts for a publication, you often need to match an existing style and shift focus to readability over exploration. Design around a message or results instead of leaving interpretation open-ended. Finally, you need to export your charts in the required file format with the correct dimensions and resolution.

Become a member for access to this — plus tutorials, courses, and guides.

✚ How to Make Ternary Plots in R, with ggplot2

When you want to compare between three parts of your data, ternary plots might be a good option. Here is how to make them. Read More

✚ How to Make Animated Histograms in R, with ggplot and gganimate

Make them move to show a shift in distributions over time. Read More

✚ How to Make Animated Histograms in R, with ggplot and gganimate

Make them move to show a shift in distributions over time. Read More

✚ How to Visualize Anomalies in Time Series Data in R, with ggplot

Quickly see what's below and above average through the noise and seasonal trends. Read More

✚ How to Visualize Hierarchical Graphs in R, with ggraph and tidygraph

Network graphs are a good way to find structure and relationships within hierarchical data. Here are several ways to do it. Read More

✚ How to Make a Grid Map with Histograms in R, with ggplot

Layout multiple charts in a single view. Then adjust the scales appropriately for maximum comparability and a unified graphic. Read More

✚ How to Make a Bump Chart in R, with ggplot

Visualize rankings over time instead of absolute values to focus on order instead of the magnitude of change. Read More