The end of this blog?


Last week's post is planned to be the final one for The Genealogical World of Phylogenetic Networks, at least for the time-being. This post is simply to say goodbye, and to say thanks to all of our readers.

As some of you may know, Blogger has decided that it is no longer interested in having contributors who work on desktop computers. They have changed their author interface to one designed for swiping and pressing on a small touch-screen, not typing and mousing while looking at a full-size screen. This new interface is almost unusable on my computing equipment — they have taken a limited but quite usable system and made it unworkable, in practice. *

Notably, the new system for automatic formatting of the posts does not match the format of our blog, and there is thus now an added onus to do everything manually, undoing the mess created by the automatic formatter, or typing in the HTML code for yourself (which is what it seems to assume you actually want to do). It won't even paste images into the right place in the text!

Even worse, Blogger (owned by Google) will no longer even allow me to log-in using my version of Chrome (owned by Google); Safari (owned by Apple) can no longer display the administration pages at all; and Firefox (owned by Mozilla) will allow me to work on posts but not allow me to comment on them.

Moreover, recently Blogger unexpectedly deleted one of my completed posts, without warning. It has not done this for a long time, and it will be the last time it does it to me — I have had enough of the new system.

So, after more than 8.5 years (the first post was on February 25, 2012), it is time for me to say goodbye. I have had six co-authors, at various times, and I thank them very much for being here. We have now written 663 posts about lots of topics, most of them related to phylogenetics in one way or another — and most of it seemed like fun at the time, although obviously a lot of work for everyone. Here is a graph with a brief timeline, as Guido's summary of the blog's history (click to enlarge).

Timeline of the Genealogical World of Phylogenetic Networks

Finally, thanks to all of you, for being readers — it would be awfully lonely here without you. By my calculations, we are currently getting c. 2,000 non-bot hits per week, which is very respectable. (NB: viewbot hits have comprised at least 20% of all traffic, first detected after c. 100 posts.) The blog is treated as a "real" scientific output, and the posts are thus indexed by sites like Altmetric (there are a couple of their example pages shown below).

The Comments facility will soon be switched off. The blog itself will remain online, for any new readers; but it will effectively be an archive, until such times as Blogger decides to delete it (whether intentionally or not), or someone has the inspiration to create a new post.

cheerio

David
david.morrison@ebc.uu.se


* My local liquor chain (the only one in the country!) has just done the same thing. Instead of having one web page with all of the relevant information for each item, there are now half-a-dozen pages, each with a small amount of information, and with VERY BIG text. Parts of the new site do not work at all on my computer; and they have taken away facilities that I actually relied upon. I find this new site just as unusable as the new Blogger.


Here are a couple of example Altmetric pages referring to our blog posts (also provided by Guido).


Posted by in Uncategorized

Permalink

Tattoo Monday XXI


There are a number of tattoo designs that incorporate the concept of a Tree of Life with the concept of DNA. A selection of these was included in the previous post, Tattoo Monday XX. Here are a few more.


Posted by in Tattoo

Permalink

Herd immunity and the end of Covid-19


Following on from my previous posts about the SARS-CoV-2 virus, and Covid-19, the human disease that it causes, there are a number of miscellaneous topics that could also be discussed. Unfortunately, this is only a part of the post that I originally intended. I had written about some aspects of the pandemic that seem to be less well known. However, Blogger deleted the draft without warning, and this is the only part that I could recover.

Here, I talk about how the pandemic ends, as far as biology (rather than society) is concerned.
There is a lot of wishful thinking at the moment, that production of a vaccine will see the end of the pandemic, but the World Health Organization has warned that this may not be so. For example, they are apparently trying to develop a 5-year strategy for Europe, not a 5-month one. One of their officials, Hans Henri Kluge, has noted: "The end of the pandemic is the moment when we as a society learn how we can live with the pandemic."


Biologically, safety from pathogens involves what is called herd immunity. This refers to the proportion of the population who are not infectious, and thus are not spreading the pathogen (whether it is a virus, a bacterium, an apicomplexan, or a fungus). Lack of infectiousness can be achieved by:
  1. being resistant to the pathogen in the first place, perhaps due to past immunological events (eg. Coronavirus: How the common cold might protect you from COVID)
  2. becoming infected and then recovering, by producing antibodies or T-cells (eg. This trawler’s haul: Evidence that antibodies block the coronavirus)
  3. being vaccinated, which produces the same immune response as 2., by producing protective antibodies.

Note that 2. is not necessarily dangerous for most people, as reports show that anything up to half of the people who have antibodies to SARS-CoV-2 did not report clinical symptoms, or only mild symptoms. [Note also: lack of symptoms does not mean that you are not infectious.] However, the variation in human response has clearly been huge (see From ‘brain fog’ to heart damage, COVID-19’s lingering problems alarm scientists), in many cases resulting in cytokine storms, and death.

The main risk factors are also clear — age and gender (The coronavirus is most deadly if you are older and male — new data reveal the risks), and any pre-existing medical conditions, notably obesity (Individuals with obesity and COVID‐19: a global perspective on the epidemiology and biological relationships). Furthermore, we do not yet know how long any immune protection lasts — for example, we now have people who have been infected more than once (Researchers document first case of virus reinfection), although most have kept their antibodies for at least 4 months (Fyra av fem behåller antikroppar mot nya coronaviruset).

Nor do we yet know about the success or danger of 3., because it normally takes a couple of years of clinical trials before a vaccine is approved for use, and even then we can get it badly wrong (cf. the originally undetected side-effects of thalidomide). As far as health care is concerned, responsibility for treatment of any unfortunate outcomes from immunization is not at all clear. Furthermore, those nations that spend the most on healthcare per person may not be ranked highest for health outcomes and quality of care (see: What country spends the most on healthcare?). Therefore, it is hardly surprising that many people are concerned about taking any new vaccine (A Covid-19 vaccine problem: people who are afraid to get one), and that the World Health Organization is being much more cautious than many government leaders (Most people likely won't get a coronavirus vaccine until the middle of 2021).

Nevertheless, once herd immunity is achieved in my local population, I am relatively safe, irrespective of whether I have been vaccinated or not — there will be few infectious people around me, and so I am not very likely to catch the pathogen. Personally, I could wait a while to see how the myriad new vaccines affect people, as they have been rush-produced in a way that would not normally be accepted as safe for public use (what is called the Phase 3 trial takes time). After all, there seems to be an awful lot of politics involved, especially in the USA (The 943-dimensional chess of a trustworthy Covid-19 vaccine).


Some calculations

The point here is that the development of any epidemic is an interaction between infectivity, herd immunity and infection control. Let's consider some explicit numbers to make this clear (based on: Flockimmunitet på lägre nivå kan hejda smittan).

Infectivity refers to how the pathogen spreads among the at-risk population, usually described as the basal reproductive rate (R0). If each infected individual infects 2-3 others, then the R0 value is c. 2.5 (each person infects 2.5 other people, on average). This means that the epidemic must spread — if R = 1 then there is no spread; and if R < 1 then the infection slowly dies out (it stops instantly if R = 0).

Clearly, infectivity can be reduced by any infection control measure that reduces R. Some of these were listed in the previous section. These measures can easily reduce the initial R0 by one half, meaning that the epidemic spreads much more slowly, if R = 1.25.

Herd immunity comes into this by also reducing R. For example, if herd immunity reaches 60%, then only the remaining 40% of the people are susceptible to the infection. If we combine this 40% with the initial R0 = 2.5, then R = 1, and the epidemic no longer increases. That is, we now have it under control. Moreover, if we have managed to get to R = 1.25, then a herd immunity of even 20% will cause the epidemic to decrease.

Bhoj Raj Singh has a good slide presentation elaborating on this topic.

These calculations interact with the concept of relative risk, of course. The calculations so far assume that infection exposure is random in society, which is obviously too simple an idea. Some people are more socially active than others, are thus likely to be more exposed, and they will then quickly achieve significant herd immunity. Others find it difficult to self-isolate because of their work or social conditions, which also increases the development of herd immunity. All of this also helps more isolated people, of course, because they are not at risk of infection from those active groups with herd immunity.

We would thus expect herd immunity to develop first in cities (eg. Experts say Stockholm is close to achieving herd immunity ; A third of people tested in Bronx have coronavirus antibodies) and in poor communities (Herd immunity may be developing in Mumbai’s poorest areas), both of which seem to be the case for SARS-CoV-2.

Equally importantly, herd immunity cannot develop if we all hide from the virus. This has happened in New Zealand, for example, which has so far successfully quarantined itself from the rest of the world — they have not successfully fought the virus, they have instead successfully hidden from it. The issue is that the populace can never come out of hiding, and can thus never let anyone come into the country, not even returning New Zealanders. As an example, Hawaii had the same isolation advantage, and then lost it, just as expected (Hawaii is no longer safe from Covid-19), as also did Australia (Coronavirus (COVID-19) current situation and case numbers).

It is a classic question: which is better, fight or flight? In a pandemic, flight cannot lead to herd immunity, which is what we need in order to "learn how we can live with the pandemic".

So, where are we now? Well, a recent poll in the USA suggests that it is an even split about whether people will actually take a vaccine if offered soon (U.S. public now divided over whether to get Covid-19 vaccine). Will 50% be enough to ensure herd immunity in that country?

Coronavirus patterns of spread


Following on from my previous posts about the SARS-CoV-2 virus, and Covid-19, the human disease that it causes, there are a number of miscellaneous topics that could also be discussed. So, here are a few topics about the spread of the pandemic, which may be of interest.

Networks of cases

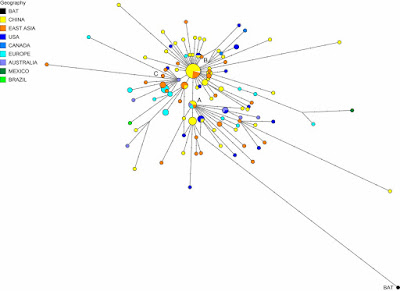
I have so far not presented a phylogenetic network related to the current pandemic. I may one day do so, although collating the data I would like to use will not be easy. In the meantime, the folks over at Fluxus Engineering did publish a network of genomes back in April: Phylogenetic network analysis of SARS-CoV-2 genomes.

Network of SARS-COV-2 genomes

The authors identified:
... three central variants distinguished by amino acid changes, which we have named A, B, and C, with A being the ancestral type according to the bat outgroup coronavirus. The A and C types are found in significant proportions outside East Asia, that is, in Europeans and Americans. In contrast, the B type is the most common type in East Asia, and its ancestral genome appears not to have spread outside East Asia without first mutating into derived B types, pointing to founder effects or immunological or environmental resistance against this type outside Asia.
Needless to say, their paper generated some controversy, with three published responses criticizing the methodology (these are shown at the link above). However, the Global Initiative on Sharing All Influenza Data (GISAID) uses an expanded version of their cladistic classification.

Networks can also be used much more locally, to illustrate spread, although in an epidemic this will almost always be tree-like rather than reticulating. Here is a recent example from China: Large SARS-CoV-2 outbreak caused by asymptomatic traveler. The authors comment about the wide spread from a one individual:
An asymptomatic person infected with severe acute respiratory syndrome coronavirus 2 returned to Heilongjiang Province, China, after international travel. The traveler’s neighbor became infected and generated a cluster of >71 cases, including cases in 2 hospitals. Genome sequences of the virus were distinct from viral genomes previously circulating in China.


Different patterns of infection among communities

Pandemics are actually a series of local epidemics, and are therefore rarely simple things, in terms of when people become infected. For example, there are often a series of alternating "waves" of new cases, in response to the behavior of either the pathogen or the people themselves.

In the case of the Covid-19 disease, the virus has so far apparently produced a series of at least seven variant strains (Geographic and genomic distribution of SARS-CoV-2 mutations), but the waves are mainly the result of people's implementation of infection control measures. Depending on the pathogen, these measures can include: social distancing, fewer / smaller crowds (especially indoors), working from home, closing social venues such as restaurants and bars, as well as mass testing and infection tracking. Reducing the spread of breath aerosols also works well for SARS-CoV-2, including careful cleaning of surfaces, and wearing gloves and masks or visors.


So, early on in most epidemics, people get infected because they are not ready to deal with things; and the number of cases increases, as shown in the above graph of Covid-19 cases in the USA this year — this is the First Wave. The number of cases then usually decreases for a while, in response to the effectiveness of the control measures. However, if the measures do not remain effective, or the people get sick of implementing them, then the number of cases increases again, creating the Second Wave. The graph above makes it clear that for the USA the Second Wave has been much more serious than the First, in terms of the number of cases.

However, this picture is often much too simple, because the USA is a pretty big place. In this example, there are 50 main jurisdictions in the country, and there is no reason to expect any epidemic to proceed in the same way in every state and territory. Here are equivalent graphs for four different US states, each showing a different pattern of waves.


So, New York (and several other north-eastern states) got the SARS-CoV-2 virus early on, and most of the at-risk people got infected at that time, so that there has not yet been a Second Wave. Rhode Island, on the other hand, has actually had a small Second Wave. From here on in the north-east, infections are likely to be mostly local outbreaks (eg. New York city mayor says rise in Covid-19 cases in Brooklyn not a cluster), such as is now also being observed in Europe.

By contrast, Louisiana, the state with the highest percent of cases (per population) so far, had a relatively small First Wave, and it is the Second Wave that has been much more problematic for epidemic control. Even more extreme, Florida (and other states like California) had the virus spread much later, so that there was not really a First Wave at the same time as the other states, and it is the Second Wave that is producing the high percentage of infected people.

So, the country's pattern of pandemic spread is made up of a series of different sub-patterns of epidemics, with different jurisdictions having very different degrees of success in controlling virus spread. This matters very much for any national response to the pandemic, because it is not the same epidemic everywhere.

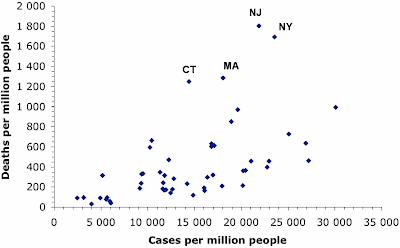
In a similar manner, deaths have been concentrated in those places that got the SARS-CoV-2 virus early on. We expect for most pandemics that the number of deaths will rise as the number of infection cases rises. This next graph shows the case rates (proportion of people infected) and death rates (proportion of people who have died) in each US state (each point represents one state, plus DC).

Covid-19 death rates in the states of the USA

The proportion of cases varies from a low in Vermont to a high in Louisiana, and the proportion of deaths rises along with this — 44% of the variation in deaths between states is correlated with the difference in case rate. However, there are four states in the north-east of the country (as labeled on the graph) where the death rate has been much higher than expected (about double). These states all got their virus infections early in the pandemic, so that one or more of these has been happening:
  • the deaths predominantly occurred before effective treatment strategies were developed;
  • the at-risk groups are now being protected more effectively; or
  • the currently predominant strains of the virus are less deadly than those circulating originally.
As I noted in my previous post: It is about time we started behaving rationally in response to Covid-19?. A rational response needs to take into account geographical variation in the current state of the pandemic. A one-size-fits-all response cannot be particularly effective in the face of large variation.

Comparing lock-downs to voluntary isolation

Many governments have responded to the spread of SARS-CoV-2 by instituting economic lock-downs as a form of quarantine, to keep their populace apart from each other. This is expected to be effective biologically, because the virus is spread by aerosol droplets, and keeping people apart reduces the risk of infection (eg. 1 m when breathing, 2 m when sneezing, 4 m when coughing).

However, lock-downs have not been universal. In particular, Sweden has become well-known for leaving social distancing as a voluntary exercise, although along with strict recommendations — see my post: Media misunderstandings about the coronavirus in Sweden for an explanation of the actual situation. The essential difference is between a government mandated and enforced response and a response based on social co-operation.

The economic consequences of lock-downs have been very serious, and we have constant media reports about how dire the situation has been for various industries. So, it is interesting to compare the spread of the virus in Sweden with the spread elsewhere, as a simple means of estimating how effective the lock-downs have been.

One possible comparison is with the United Kingdom. The pandemic started in both countries at the same time (first reports on 26-27 February), and the current total death rates (attributed to Covid-19) are similar (Sweden: 576 people per million, UK: 611 people per million). The case rates are quite different, however (Sweden: 8,305 people per million, UK: 4,897 people per million), and this might be attributed to the two different strategies. [Note: the USA also has a similar death rate (564 per million) but a much high case rate (18,495 per million).]

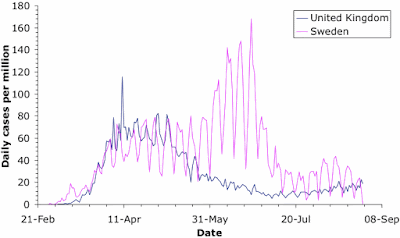
Coronavirus case-rates for Sweden and the UK
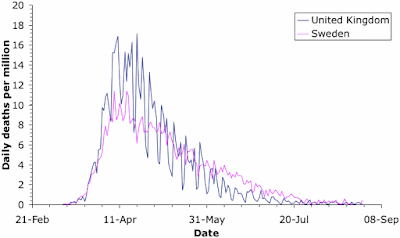
Coronavirus death-rates for Sweden and the UK

For a meaningful comparison, we need to look at the rates, not the raw data, because the two populations are very different in size (Sweden; 10 million, UK: 68 million). These two graphs show the case rate and death rate through time for the two countries. The comparison is quite revealing. [Note: the saw-tooth patterns in the graphs come from the fact that medical reports in most countries are notably fewer on weekends.]

As expected, the cases initially increased faster in Sweden. However, the case rates were very similar in the two countries by the last week of March; and they remained so until Sweden started serious virus-testing in late May. Just at the moment, the case-rates are similar again, although the UK has actually done twice as much virus testing as Sweden (240,000 tests per million people versus 110,000). Anyway, the two different government responses did not produce much difference in the number of cases for the first 3 months of the pandemic.

The death rates show quite a different pattern. The rates started off very similar, but by the end of March the UK actually had a higher death rate than Sweden. This situation was maintained until the end of May, after which Sweden had the higher rate until the end of July. Once again, the two countries are now very similar. Overall, the time-course of deaths is highly correlated between the two countries (79% shared variation), while the case rates are not (7%).

Of particular note here is that the differences in case rates have not resulted in differences in death rates. Apparently, Sweden's voluntary response has allowed a greater proportion of the population to become infected but this has not resulted in more deaths. I am fairly sure that the authorities will attribute this to the development of herd immunity (which I will talk about in my next post on the coronavirus) (WHO expert praises Swedish strategy - urges other countries to follow suit). [Note: a direct comparison with the USA would be pointless, given the geographical variation discussed above.]

The consequences are far-reaching. As but one example of the unfortunate consequences of the UK lock-down, you could read up on the fiasco concerning the final-year school exams (A coronavirus lesson about the modern state) — without a lock-down, Sweden avoided such problems for its young people.

Conclusion

There is a wealth of data in this pandemic, enough to keep data analysts busy for a very long time. I am sure that we will be inundated with reports for many years to come. In the meantime, like all pandemics, the geography of the local epidemics is a vital point in implementing effective control strategies.

Isn’t it about time we started behaving rationally in response to Covid-19?


I have written a few blog posts recently about the current Covid-19 pandemic, caused by the arrival of the SARS-CoV-2 virus in our lives. This interests me as a biologist with some background in the study of pathogens (disease-causing organisms).
There have been two extreme responses to the current pandemic. There are all sorts of variants in between, of course, but I will start by characterizing the extremes, and then move on to some practical examples. The point here is that we need a reasoned response to this pandemic, based on the effect of the virus on people, and the make-up of the populations being affected. The current one-size-fits-all approach used by most governments is not going to work, long-term.

The future of having to live with the virus is becoming clearer. Actions can be individual, but they need to be co-ordinated, with each of the risk groups being treated appropriately. Even if you personally feel secure, those around you might experience risks very differently. An all-purpose set of mandated behaviors might work short-term, but we cannot continue to live that way. Behavior needs to make all risk groups feel safe at all times, by being targeted appropriately.


Behaviors

At one extreme, people are trying to hide from the virus. By this, I mean that they are trying to keep away from it. Obviously, many people are doing this individually, but whole countries have also been trying to do it, notably Australia and New Zealand, which are geographically isolated by virtue of being islands. At the other extreme, people are trying to "crush" the virus, like they are playing poker against some weak opponent.

The problem with the first extreme is that you can never come out of hiding, because the virus does not go away, it just sits there (like viruses do) until you finally come past, and then it will get you, after all. This is what the so-called Second Wave of infections is currently showing us. The First Wave of infections occurs because people do not know about the pathogen, and therefore catch it inadvertently. In response to the rapid increase in case rates, people go into self-quarantine, trying to prevent themselves from encountering the virus. This works, but they eventually get tired of doing it, and they come back out again — and that is the Second Wave of infections. It is nothing new as far as the virus is concerned, it simply reflects changing human behavior (out, in, out again).

A prime example of the other extreme is expressed by this recent New York Times article: Here's how to crush the virus until vaccines arrive, or even the Wall Street Journal: The treatment that could crush Covid. You can't crush a pandemic, as we know from the seemingly endless series of previous pandemics in recorded history, and presumably many more of them before we learned to write. Naturally, Wikipedia has a List of epidemics, for you to peruse.

However, at some stage, people are going to have to start treating the current pandemic like the influenza virus — a natural part of their environment, where they take standard precautions to minimize their risk. In response to the perennial threat of flu, old people take vaccines in winter, middle-aged people stay away from public transport during flu season, and young people simply get on with their lives (because a bit of flu will not kill them). These are rational responses, taken by people after evaluating the perceived risk of infection to themselves.

To do this for Covid-19 we need to consider what we have learned so far this year.


We need to learn

During the First Wave of any pandemic we need to over-react, while we find out how the new pathogen behaves and what effects it can have. So, we try everything from social distancing to lock-downs, to see what seems to work in practice. The objective is to reduce the rate of spread of the virus — in biological terms, we are trying to work out what things will flatten the curve (see: Coronavirus: What is 'flattening the curve,' and will it work?).

For example, one current debate is: do face-masks provide protection, in the community setting? They work in hospitals, for sure (Face masks really do matter: the scientific evidence is growing), but that is a specialist environment, where they are used by professionals in conjunction with other methods (hand scrubbing, special clothing, etc). We need to find out whether people can routinely wear face-masks properly, so that the masks do what they are designed to do. We may actually be better off with perspex visors, for example, which are also effective at preventing the spread of breath aerosols (which is the main problem), and they can be worn effectively even by a novice — and they do not make us all look like we are involved in a bank hold-up.

We also need different groups of people to try different approaches, to see how effective they are. If everyone does exactly the same thing, strictly following World Health Organization recommendations for example, then we do not learn much, as a global community. That is, a pandemic is simply a widespread (global) series of epidemics, one in each local area. Since countries are all different, culturally, this cultural diversity creates the ideal environment to maximize learning-by-doing, by treating the pandemic as a set of epidemics, to which we might respond differently.

For example, the Buddhist-dominated communities of South-East Asia have done things in a very community-cooperative manner (these people do not work alone, by choice); and they collectively have the lowest infection rates on the planet. The Muslim-dominated countries of the Middle East do not worry much about life threats (whether they die or not is the Will of Allah), and they collectively have the worst rates. The individual creed of Americans does not encourage them to act co-operatively (resulting in draconian government-mandated lock-downs), and so they also have a very high rate. Sweden is one of the few remaining socialist cultures, where governments give advice rather than issuing instructions (resulting in this case in co-operative self-quarantines), and they have a middling-to-high infection rate.

We learn many things about alternative effective actions from this cultural diversity. In particular, media criticism of the different national reactions to the pandemic is now dying down, as the critics slowly come to realize that uniformity always results in an all-or-none outcome.


What have we learned?

Okay, so after the First Wave we know that this new virus can do everything from: apparently nothing (there are plenty of people with antibodies who have never felt any symptoms of having had the virus), to creating flu-like symptoms (key symptoms: fever, cough, skin rash, loss of taste & smell), on to hospitalization (with usually c. 7 days to get rid of the symptoms but 5 weeks to get rid of the actual virus), or even intensive care (as a result of what is medically called a cytokine storm). For the elderly, and others with pre-existing medical conditions, the virus seems to be one thing too many for their body, the proverbial straw that breaks the camel's back — which can lead to death sooner rather than later.

So, not only does SARS-CoV-2 infection not mean death for the vast majority of people (globally, < 3.6% of reported infections have resulted in death), it does not even necessarily mean sickness at all (eg. a Swedish study showed that 46% of those study people with antibodies had never reported clinical symptoms). This should mean something for our future responses.

Notably, in those countries where a significant Second Wave is now occurring, the new infections are often not resulting in deaths (except notably in Australia). This is a very important difference between the First and Second Waves, in most places. There is speculation that the SARS-CoV-2 variants currently widespread are less deadly than were those common at the beginning of the pandemic; but it is equally likely that those people who were most susceptible to the virus have already succumbed during the First Wave.

So, we now know about the risk groups, roughly, which is as good as we ever know such things; and we have a good idea about the outcomes of the various risks. This means we can start to do some reasoned things, as a pandemic response. The Second Wave is a perfect time to start treating the Covid-19 situation rationally.


The time for some new action?

This means that it is time to start targeting actions to the degree of risk for each person, rather than having over-arching actions that affect everyone equally. Our individual responses to the virus are not equal, so why are most government actions still predicated on the idea that we are all equal?

The point is, we have to respond to what we have learned about relative risks. For example, I have argued before that the biggest mistake Sweden has made was letting Covid-19 get into the aged-care facilities, which is where most of the country's deaths have now occurred. Has anyone learned from this mistake? Apparently not in the USA: Untested for Covid-19, nursing-home inspectors move through facilities. Come on people — get your act together.

The response to the First Wave always needs to assume equality, because anything else would be irresponsible, in the face of our initial ignorance. During the Second Wave, however, we are no longer quite so ignorant, and we can tailor our actions to suit the conditions. When are we going to start doing this?

In order to think about this question, it is worthwhile to consider a few topics that seem to be on the agenda, and look at some practical examples of three relevant situations.


Trying to hide

Any country that successfully hides from the virus has to keep hiding, forever. New Zealand has recently been crowing about having gone 100 days without a new coronavirus case. That record was destroyed this week (New Zealand on alert after 4 cases of COVID-19 emerge from unknown source); and it will get even worse on the day they allow the first visitor into their country. Their current Alert Level 3 response cannot change this — you cannot hide from a virus.

New Zealand's near neighbor, Australia, has demonstrated this point even more strongly. In one sense, the Australians understand quarantine, because it is a big part of keeping plant and animal diseases out of their country. For example, international visitors are regularly surprised to have biological products (notably wood) confiscated at the arrival airport — better safe than sorry.

So, dealing with Covid-19 should be straightforward for them — you just apply the same idea to the people, themselves. Sadly, it took them some time to realize that you have to take people straight from the airport to a quarantine hotel, if the quarantine strategy is to work. One of my nephews returned to Sydney (Australia) from Copenhagen (Denmark) at the beginning of the First Wave, and he had to make his own long way by public transport from the airport to the quarantine house that his father had arranged!

So, it should not be a surprise that quarantine has not been effective everywhere in Australia — one mistake is all it takes. This mistake was made in the quarantine hotels in Melbourne (Victoria), where the quarantine security turned out to be a joke (see: New coronavirus lockdown Melbourne amid sex, lies, quarantine hotel scandal). Perhaps the security guards should have read the earlier article on: Sex in the time of coronavirus.

The issue here is that Australians are no better than Americans at following government instructions — individual rights take precedence (see: Individual choice is a bad fit for Covid safety). Even my local newspaper here in Uppsala (Sweden) reported (Regel brott ger böter) the news that military personnel were sent to visit 3,000 Australians who were supposed to be in self-quarantine at home (due to having tested positive for the virus), and 800 of them (one-quarter!) were not at  home. I lived in Australia for 40 years, and this situation surprises me not at all.

So, hiding does not work, long-term, because you have to keep it up for too long to be practical for most people. The Second Wave in Victoria is actually worse than the First Wave, in terms of number of Covid-19 cases. The ensuing lock-down is now even worse than it has been in most other places (see: 'Very dead': army and police patrol the deserted streets of coronavirus-stricken Melbourne); and Victoria itself has been quarantined from the rest of the country.


Schools

We have all been told that the effect of Covid-19 is age-related; and the global data shows that this is true everywhere — the older you are, the more likely you are to seriously affected. One outcome of this knowledge is that actions can be tailored to age groups. Notably, we can consider the idea that massively disrupting the lives of very young people may be doing more them harm than good, due to stress if nothing else (Lockdowns and school shutdowns may make youngsters sicker).

Most countries mandated the closure of schools, and instituted some form of working from home for the pupils. This move was predicated on the idea that children will catch the virus in the crowded schools, and bring the disease home to their elders. This scenario seemed to be the case, for example, in the early spread of the SARS-CoV-2 in northern Italy.

Recent evidence, however, suggests that, while the youngsters do catch the virus, they are much less infectious than older people (see: COVID-19 study confirms low transmission in educational settings). We are talking about pre-teenagers here, not older children. This does not mean that they can't spread the virus (see: Latest research points to children carrying, transmitting coronavirus), but merely that this is a much lower risk.

It has therefore been suggested that a rational response would involve a trade-off between disrupting the lives of very young people versus the risk of viral spread (see: Why it’s (mostly) safe to reopen the schools). Notably, this issue was explicitly considered in Sweden, and during the First Wave it was decided to keep the junior schools open, but to close the senior schools (ie. high school). So, the younger children have all been trundling off to school every week-day, just as usual, the whole time. As far as I know, there has not been even one reported outbreak involving any of the open schools.

This is why I emphasize the importance of culturally diverse responses to a pandemic. In this case, the Swedes seem to have got it right; and everyone else could learn from this.


Young people

It is a different matter for somewhat older (but still young) people. The so-called Millennial generation has had a pretty tough time, especially financially. This is the second financial down-turn that they have experienced in a dozen years, just when they are trying to get themselves onto their own two feet (see: Millennials slammed by second financial crisis fall even further behind).

So, none of us should be surprised that these people are thoroughly sick of restrictive pandemic responses by now. Indeed, it is becoming widespread news that case rates are increasing among 20-29 year olds (or 15-25, depending on how people are grouped) (see: WHO urges young people to help control the spread of coronavirus). This has become particularly obvious in Europe (see: Coronavirus cases rise in Europe as youth hit beaches and bars), but also in North America (see: B.C. hospitalizations, deaths steady as latest wave hits mostly young people) and Australia (see: Coronavirus Australia: Why young people are spreading COVID-19).

This is not necessarily as bad as it might sound, because the effect of the virus is age-related, and these people will probably mostly be safe (but not all). The same thing is true for somewhat younger people — youth is a social time, and mandated restrictions about distancing may not be very effective (see: Why the teenage brain pushes young people to ignore virus restrictions).

Places like Japan and Spain are now cracking down on bars, and the like (eg. Spain cracks down on outdoor drinking, smoking in renewed push against COVID-19). If you want some survey data on what activities U.S. people currently feel comfortable doing, then check out: Weekly updates on consumers’ comfort level with various pastimes.

In this situation, Sweden has not been exempted; and recent coronavirus cases have become prevalent in the 20-29 year old group, just like elsewhere else. Once again, this emphasizes that our knowledge cannot all come from one place. No-one gets it all right, but they may get some things right; and we should learn from both success and failure. This is the rational approach, not the one-size-fits-all approach.

Adding to this scenario, as I write this blog post, Europe is having a warm spell (up to 40 °C in the south), and my local newspaper has the headline: Chaos on Europe's beaches in the heatwave. All governments are warning about the need to continue keeping people apart, for those who wish to avoid infection. Fortunately, the summer holidays are nearing their end in the northern hemisphere.


Concluding comments

From the biological perspective, for the future to be bearable, we need to reach herd immunity, which refers to public safety in the presence of a pathogen. This is determined by the proportion of the (local) population that needs to become immunized (either by becoming infected or by being vaccinated) in order for the infection to stop spreading (see: A new understanding of herd immunity).

We can achieve herd immunity by responding rationally based on the make-up of the population, in terms of the relative risks. At-risk groups need to be protected, while the rest of the people get on with their lives. For example, Stockholm, in Sweden may now be getting close to herd immunity (or flock immunity, as the locals would call it), the Swedes having foregone the lock-downs imposed elsewhere, and thus allowing immunity to arise naturally.

Herd immunity can be achieved without rationality, of course — we simply wait for the weakest people to die, and the rest are likely to be safe. You might not like the moral implications of doing this, but it is biologically effective, nonetheless. For example, India may potentially end up with the world's worst case-rate for infections, given its population size and large degree of poverty in many areas (where social distancing is not feasible). However, its saving grace, in terms of deaths, may well be the consequent fact that poor people are usually young, because poor people do not live long in the first place. Herd immunity to SARS-CoV-2 is easy to achieve under these circumstances (see: Herd immunity seems to be developing in Mumbai’s poorest areas).

I vote for the rational approach, myself, among the many biological alternatives.

Coronavirus statistics are (almost) all misleading


There are plenty of places on the internet where we can access statistics about the current Covid-19 pandemic, caused by the rapid global spread of the SARS-CoV-2 virus — notably Johns Hopkins University (formally described here), and Worldometer. These are compilations of official government statistics, comparing different countries, or states within a country. These are potentially interesting, because we can see how things are progressing in our own location, and compare it to other places. If nothing else, this might inform our own actions for protecting ourselves.

The basic problem is that these data are often not comparable between jurisdictions, in the sense that they will have been collected in different ways and with different degrees of success. For example, consider these two recent articles about the country that is very likely to end up being the worst hit:
The second one contains this quote that sums up the issue: "India is the third-worst hit country in the world, but there are concerns a lack of testing could mean the true figure is far higher." Government organizations usually do their best to collate their local data, but their relative success in a situation like this will vary from "okay" to "abysmal". We cannot really know where any given dataset fits into that continuum, and this profoundly affects how we interpret the data.

ourworldindata.org/coronavirus

Data must be comparable if we are to compare them. This is an obvious truism, especially in science; but achieving comparability is often very difficult in practice, and scientists spend much of their time trying to achieve it in their own work. I would hate to be the person delegated the job of summarizing this pandemic globally, because they will really be us against the wall. But someone will have a go at it, believe me, and I wish them every success.

In this post, I summarize the main data-collecting issues, as they are currently understood. The two main statistics reported are the number of infection cases and the number of resulting deaths, which have separate issues.

Case numbers

Deciding whether a particular person is a Covid-19 case is not straightforward. Three main criteria have been used to date:
  • disease symptoms (which are similar to influenza)
  • detection of a viral genome in the body (meaning the person currently has the virus)
  • detection of virus antibodies in the body (meaning the person has previously had the virus).
These three criteria will yield different estimates of the number of cases.

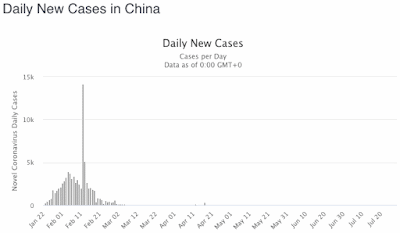
Since the virus seems to have originated in China, the Chinese were the first to officially count cases. They started by including only those people who had been tested for the virus itself (after they showed symptoms), but soon realized that this caused a delay before these people received medical treatment. So, the official data show a massive spike in case numbers, when the authorities switched to using symptoms alone to count cases. You can see in this graph (from Worldometer) which day that was.

Coronavirus cases in China

Using symptoms alone presumably over-estimates the number of cases, because of the similarity of coronavirus symptoms to those resulting from influenza viruses. Clearly, symptoms need to be confirmed by a direct test for each particular type of virus.

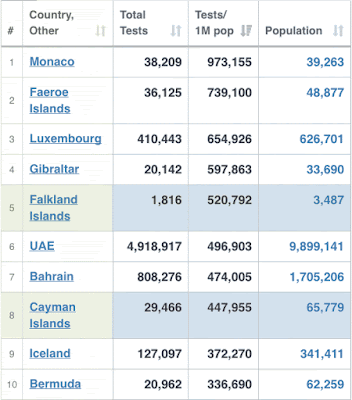
However, without a concerted testing effort for SARS-CoV-2, the number of cases will be under-estimated, probably by a large margin. We now know that many people show few or no symptoms of this coronavirus, and will therefore not be detected if we test only those people with explicit symptoms, and who visit a testing center. Some countries have made massive testing efforts, relative to their population size, while many other countries have been much less active. This table shows the top data from Worldometer, counted as the number of tests per million people.

Coronavirus testing per million people

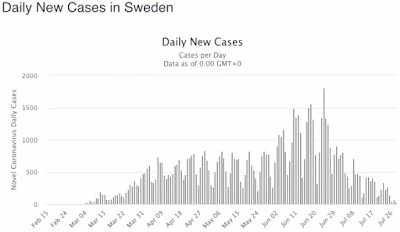
Clearly, the more of your population you test, the more likely you are to correctly detect all of your cases. The effect of this can be seen in this next Worldometer graph, for Sweden. The apparent burst in cases after June 5 was due to the government finally implementing large-scale virus testing, which naturally increases the detection rate for this type of situation. That is, the data were greatly under-estimated before June 5, and the official data were corrected during June, by catching up with many of the as-yet-undetected cases. This increased testing has continued, which means that the drop in cases during July is cause for optimism, as in any situation where you search for something bad and don't find it. Nevertheless, these tests cover only 8% of the population, to date, and so even now the data may still (theoretically) be under-estimates.

Coronavirus cases in Sweden

So, between-country comparisons are misleading, unless the same amount of virus testing has been conducted. This is the point I made about India, above, where testing is a real challenge given the size of the population. Those of you in the USA might like to contemplate just how many cases you really have — your officials have conducted more tests than anyone else except China, but you still have covered only 17% of your population (the table above is cut off at 30% coverage).

Alternatively, antibody testing is a good way to detect people who have had the virus without knowing it, since this studies their body's reaction to the virus rather than looking for the virus itself. As this sort of testing proceeds around the world, the number of official cases will continue to increase. However, the number of false positives and false negatives of the antibody tests means that even they are not entirely reliable (see False positive and false negative coronavirus test results explained). Indeed, a review article assessing the range of currently available antibody tests shows remarkable variation in their success rates (Diagnostic accuracy of serological tests for Covid-19: systematic review and meta-analysis).

As a final point, which has been very obvious here in Sweden, is just how long a person is considered to be a Covid-19 case. As far as Sweden is concerned, there were apparently a lot of "active cases" early in the pandemic. However, what was happening was that most other jurisdictions were declaring cases as "recovered" after the person's symptoms receded, which takes about 7 days, and were then removed from the official list of cases. On the other hand, Sweden did not officially declare a case recovered until the person was completely free of the virus, which takes about 5 weeks. So, Sweden's reported number of active cases remained much higher than for most other places, for a much longer time. The number of Swedish cases was actively criticized by the foreign media, but the cause was never mentioned — the data were not comparable to elsewhere.

Similarly, the reporting of cases is obviously not equal throughout any given week, so that daily reports are unreliable — there are obvious weekly cycles in almost all of the national datasets, with fewer reported cases or deaths on Saturdays and Sundays. The same thing applies to regional (geographic) patterns, of course. For example, both Spain and the United Kingdom have noted that their current outbreaks are all regional, with the majority of their countries being much less affected.

Coronavirus test results

Number of deaths

This brings us a consideration of counting deaths due to Covid-19. We all know what death is, but it is not so easy to assign a particular cause to any particular death. A death certificate signed by a professional medical practitioner will assign an official "cause of death", and possibly list other "contributing factors". So, when does a death count as a coronavirus death?

The simplest solution is to say that any dead person who has a virus genome in their body counts; and it is clear that some of the statistics around the world have counted Covid-19 deaths this way. Unfortunately, as has been pointed out ironically, this counts people who are carrying the virus when they get run over by a car; and this may not be what most people mean when referring to "a coronavirus death".

Just as importantly, some jurisdictions have clearly tested, and thus counted, only those people who died in hospital. Similarly, there are clear differences in counting due to social circumstances, especially in countries with large poor communities. These factors will under-estimate the actual death rate.

The main issue, however, is that most of the people severely affected by this new virus are elderly persons with pre-existing medical conditions. For example, 7.3% of the reported Covid-19 cases in Sweden have resulted in death, to date, but 89.1% of those deaths have been in the 70+ age group. This is a bit more extreme than elsewhere, as early on in the pandemic the virus got into several aged-care facilities in Sweden. In most of these cases, the SARS-CoV-2 virus was simply one thing too many, for people whose health was already declining — this is called co-morbidity (the presence of one or more additional conditions co-occurring with a primary medical condition).

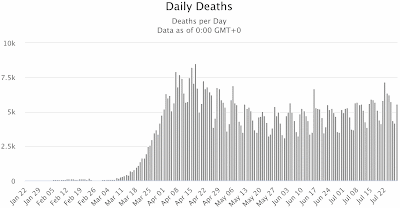
So, where is the border between a main cause and a subsidiary factor? The answer to this question clearly differs around the world; and this makes the officially reported death data non-comparable. Some data will be over-estimates and some will be under-estimates, compared to some global standard definition. So, what does the following graph, from Worldometer, really tell us?

Reported coronavirus deaths gloabally

The generally accepted solution to this conundrum is to consider what is called excess mortality, which assumes that there has been a temporary change in the number of deaths during some specified period of time. That is, we do not assign deaths to particular causes, but simply compare the total number of deaths now to the total number of deaths in previous years. The difference can be attributed directly or indirectly to the current circumstances. This is not perfect, but it is the best we have got.

So, we should compare the number of deaths during the current pandemic period with some estimate of a baseline number of deaths under more normal circumstances. The baseline is commonly taken as the equivalent data from the immediately preceding 3–5 years, or so — how many more people have died during the pandemic, compared to the average deaths during the same months of prior years?

The U.S. Centers for Disease Control and Prevention has a compilation of these data for the states of the USA, updated daily: Excess deaths associated with COVID-19. The data are still provisional, but it would be nice to think that they are directly comparable. Whether the data are actually meaningful for the current pandemic is a point I discuss at the end of this post.

Similarly, the EuroMOMO collaborative network is supported by the European Centre for Disease Prevention and Control, and provides weekly data for public health threats in 24 European countries. If you look at their graphs, you can see the age-related effects of seasonal flu in every winter since 2016, as well as the magnitude of current pandemic. Here is a graph of their current data, pooled across all age groups and countries. Roughly speaking, deaths are 80% greater than in previous years.

Excess mortality in Europe since 2016

Elsewhere in the world, data are a bit more scarce. The principal problem is lack of suitable prior data — not everywhere on the planet has accurate estimates of the local death rate, for some combination of social, economic or political reasons. Nevertheless, we have data for all of the expected places; and some of the groups who are collating the excess mortality data for the current pandemic are listed by the Our World in Data site: Excess mortality from the coronavirus pandemic (COVID-19).

These groups include three newspapers, each of which is covering the current pandemic across c. 10 countries:
All three of these make their compiled data publicly available on GitHub.

Conclusion and final point

The world is a complex place, and biology is one of the most complex parts of it. Do not over-interpret simplistic data, no matter how prettily it is presented. In particular, for data to be meaningful, all parts of it need to be directly comparable; otherwise the conclusions are likely to be wonky.

Sadly, as a final point to emphasize the issues, I will note that the USA itself apparently has rather big practical problems, as discussed in: Covid-19 data in the US is an ‘information catastrophe’. According to this media report, there are serious problems with the hospitalization data:
Covid-19 data in the US — in fact, almost all public health data — is chaotic: not one pipe, but a tangle ... Every health system, every public health department, every jurisdiction really has their own ways of going about things ... It's very difficult to get an accurate and timely and geographically resolved picture of what's happening in the US, because there's such a jumble of data.
The issue seems to be the National Healthcare Safety Network, as used by the Centers for Disease Control and Prevention, which is responsible for collating the data nationally. The Department of Health and Human Services has now taken over direct responsibility for data concerning Covid-19 infections in hospitalized patients, much to the dismay of many people.

Media misunderstandings about the coronavirus in Sweden


The worldwide spread of the SARS-CoV-2 virus, and the consequent Covid-19 disease pandemic, is still a topic of conversation, although it does seem that many people are sick of hearing about it. They just want to "get back to normal", without understanding that this is going to take many months, if it happens at all. There is every possibility that there will be a "new normal" from now on, and in many places the virus will be endemic.

We started off knowing little about this virus and the disease that it causes, as I have written about before (There seems to be a lot of public misunderstanding about the coronavirus); and we have slowly accumulated more and more understanding of what we should be doing in response. In particular, the future of having to live with the virus is becoming clearer, until (or if) we reach herd immunity (A new understanding of herd immunity).

Among all of this, there has been some commentary about the official response within Sweden, with some media (and the World Health Organization) claiming that the Swedes have reacted in a different and controversial manner. This is far from the truth, as I happen know, because I now live in Sweden, although I grew up in Australia. As a resident biological scientist, I thought that I might write about the situation, in this post. There have been massive quarantine efforts here, although for cultural reasons they might look quite different to how such things are organized in the English-speaking parts of the world. [Note: Japan has also used a different strategy to most other places, but without any serious criticism, although it is now experiencing a serious "second wave".]


Many of the misleading media reports, have originated in the USA, which currently has the world's biggest Covid problem. The latter may soon change, because there is every reason to expect India to surpass the US infection count, as its rate is still rapidly increasing and India has a much larger population. I hope to be wrong on this matter, but it will be very hard to contain spread among the masses of poor people in that country. Maybe their saving grace will be the fact that the majority of their population is younger than 40 years old, so that the death rate will be contained.

Anyway, we have had US media reports about Sweden such as these:
The latter article contains this quote:
At one end of the spectrum, Sweden chose to forgo severe restrictions on public life and its economy and opt to let the virus spread through its population while shielding the most vulnerable groups.
Both pieces of information here are wrong. Sweden has not allowed the virus to spread, but has instead instituted quarantine measures; and it has failed miserably in its efforts to protect the prime vulnerable group: the elderly.

Virus spread in Sweden

Let's start by looking at the actual data. Here is a table of the current officially reported number of SARS cases as of July 18 (as collated on the Worldometer web site). Note that the information we are interested in is the case rate (percent of population affected), not the number of cases. The number of cases is determined mainly by the population size — of course the USA has more cases than Sweden, for example, because there are 330 million Americans and only 10 million Swedes.


As you can see, the case rate in the USA is 10,500 per million people, whereas in Sweden it is only three-quarters of this, at 7,500 cases. So, who is doing better at containing the spread of the virus? Mind you, within Europe, only Armenia and Luxembourg have higher reported rates, along with tiny places like San Marino, Andorra and the Vatican City (where even a few cases can create apparent large rates, due to the small sample size).


Moreover, the number of new cases per day in Sweden is now as low as at any time since mid March, as shown in this next graph (also from Worldometer). The apparent burst in cases after June 5 was due to the government finally implementing large-scale virus testing, which always increases the detection rate for this type of situation. The subsequent decrease in cases suggests that Sweden may well be moving towards herd immunity, which is required for long-term epidemic control. This week's report from Folkhälsomyndigheten (the Public Health Agency) shows a continue decrease in the proportion of positive tests, despite a continued high level of sampling.

The Swedish situation contrasts with the current situation in the USA, where the number of new cases is higher than at any previous time, being double what it was during the April-June period. This is, at least in part, due to a massive sampling effort now on, which I noted above will increase the case detections.


The same trend can be seen in the number of new daily deaths in Sweden — it is now as low as at any time since mid March. The number of US deaths, on the other hand, has surged this month (although it is still less than a half of what it was back in April). Sweden may be a cautionary tale, perhaps; but the criticism sounds more like sour grapes, to me, from the media of a country that has clearly handled this pandemic worse than anyone else.

It is important to mention a point of difference, as it has become increasingly obvious that different jurisdictions have compiled coronavirus cases differently, even within the European Union.. As far as Sweden is concerned, there were apparently a lot of "active cases" early in the pandemic. However, what was happening was that most places were declaring cases as "recovered" after the person's symptoms receded, which takes about 7 days. On the other hand, Sweden did not officially declare a case recovered until the person was completely virus free, which takes about 5 weeks. So, Sweden's reported number of active cases remained much higher than most other places, for a much longer time, which may have generated a lot of the negative media publicity. This situation no longer applies, because the number of cases is much lower now.

I would hate to be the person who has to officially compile the worldwide data on this pandemic. Even the decision about what constitutes a "Covid death" differs between countries, with some jurisdictions including all people who test positive for the virus, irrespective of what they die of, and others counting only those cases where the virus is the main cause of death (eg. a cytokine storm). Trying to make the worldwide data comparable will not be easy.

Quarantine in Sweden

So, what has been different about Sweden? It is simply that the national government expects Swedes to take official advice when they are given it, without being forced to do so. In most cases, this actually works, although there will always be exceptions. In the case of this pandemic, the government simply gave everyone the same advice as everyone else in the world was forced to take. It really is as simple as that.

Where I spent the first two-thirds of my life, in Australia, such an approach would be laughable. because Australians do not respect their governments, state or national. So, without a police-enforced mandatory shut-down, the virus would have spread unchecked. You may have seen the media pictures of Sydney people jammed onto beaches when they were told not to go to work (Famous Sydney beaches closed after crowds flout coronavirus restrictions); and you may have read about the complete failure in the Melbourne hotel used for quarantining international arrivals (Breaches of hotel quarantine 'let Victorians down', Minister says as inquiry launched). There is nothing unexpected about this, even if I say this as an Australian citizen.

In contrast, Sweden's island summer-holiday destinations have had among the lowest infection rates in the whole country — Öland 0.3%, Gotland 0.3%, compared to a national total of 0.8%. I am not claiming that Swedes are more sensible than anyone else (or less!), merely that they take official advice without being forced. This may seem odd to you, perhaps, but it is true, as I can attest from living here for the past one-third of my life. Swedes are quite proud of being different in this way. Indeed, to a Swede, a government-enforced lock-down would probably have worked a great deal worse than the official (advisory) approach chosen.

So, businesses were told to have their employees work from home, and those that can do so have been implementing this. The recommendation remains in force until the end of the year, notably to reduce problems with public transport. Of direct effect on me, universities all immediately instituted online classes (instead of face-to-face), and this remains in force — Uppsala University is a pretty quiet place, these days. In a similar manner, senior high schools have had their students working from home (they are on summer holidays now, of course) — secondary schools are at risk of being important sources of infection (see Contact tracing during coronavirus disease outbreak, South Korea, 2020).

On the other hand, of greatest surprise to me, it was decided to keep the junior (primary) schools operating normally. This has turned out very well, because there have been no reports of any students bringing Covid-19 home to their families. It is now accepted that young children are not usually infectious, contrary to the common belief at the beginning of the pandemic (Children are not COVID-19 super spreaders: time to go back to school). This is one thing that Sweden apparently got right, contrary to actions in most other places in the world — disrupting the lives of young people is not a good thing.

In other quarantine actions, many places will now deliver your shopping order to your car, so you don't have to enter shops; and all open locations have signs about social distancing, and 1.5-meter (5 foot) marks on the floor. All public-access places have perspex screens between the service-provider and customer, and between customers; hand-washes are freely available; and cleaning services are now more strict and frequent. Most eating places serve customers outdoors only. We have been advised not to meet in groups, except outdoors, and even then there should be fewer than 50 people. All professional sporting activities have been postponed, along with other group activities, such as garden viewings (eg. Öppen Trädgård 2020 inställt).

My local supermarket now opens one hour earlier on week-days, specifically for people in high-risk groups (such as myself) during that extra time. The accompanying sign is typically Swedish, in that it points out the purpose of opening early, and asks for co-operation from other customers, but also says that this will not be formally policed. As expected from Swedes, when my wife and I go there, almost all of the people are elderly, indicating that the others are, indeed, co-operating (or perhaps do not want to get up early).

Be realistic, would this type of voluntary approach actually work in your country? The only report of a major breach of quarantine was a party held to celebrate graduating from high school. The government recommended that these parties be avoided this year, much to the disappointment of the students, as this is always a big event. One group of c. 200 people ignored this advice, and thereby spread the virus among more than 40 people (Coronasmitta spreds på stor studentfest). All countries have idiots.


There are practical problems to all of this, of course, just like in those places with full lock-downs. A personal one for me was the loss of my non-pension income. I used to help a Swedish academic with his English, but we have not met since the arrival of the virus in Sweden. I doubt that these meetings will ever resume, post-Covid.

Also, all travel has been restricted, which resulted in the cancellation of our long-planned trip to northern Sweden and Norway. All countries in Europe officially closed their borders for a few months. Within Sweden, typically, given what I have said above, we were not actually prevented from traveling, but were instead told that if we get sick we will have to be medically treated within our home county, which dissuaded everyone from going very far.

This has all changed in the past week. The ferries to Germany are now open; and it is summer holidays. This seems to have encouraged Swedes to come out of quarantine, and get on the move. This past weekend, it has become clear that relatives are visiting each other again (they are out cycling in family groups on my country roads, for example); and I have seen more caravans and campervans on the highways than I have at any time since last summer. Apparently, the summer destinations have started filling up with tourists, so this will be the test of how far Sweden has come (Tusentals turister trängs på Gotlands gator).

As a final discussion point, I will mention that I actually live just outside of town, in a small community in the countryside. So, social distancing is not a practical problem for me, unless I go into town. In my local area, there have been 24 confirmed cases out of 3,007 people, which is an infection rate of 0.8%, which is the same rate as for Sweden as a whole.

However, this introduces the issue of the non-randomness of cases, which are quite definitely clustered (A fraction of European regions account for a majority of covid deaths). Within Sweden, for example, Stockholm, as by far the largest city, has the highest death rate, as I will discuss below. So, the risks associated with infection depend very much on where you live. Sweden may have a small population, but its area is quite large, and spatial diversity is a real factor, just as it is in larger countries.

It is therefore a pity that all decisions within the European Union regarding the pandemic are done at the national level. A pandemic requires communal action, because any individual action can threaten the safety of the group as a whole. It has apparently one of the biggest "riddles" that the Buddhist countries of South-East Asia (Cambodia, Laos, Myanmar, Thailand, Vietnam) have been almost completely untouched by the pandemic that has spread to every other part of the globe (Why has the pandemic spared the Buddhist parts of South-East Asia?); but anyone who has ever watched the co-operative way in which these communities function will not be surprised in the slightest.

It has therefore been the biggest disappointment that the European Union has been surprisingly non-united in its responses. At the moment, some countries are now open to visitors from some other countries, while residents of yet other countries are currently banned. None of this seems to be based on the actual case-rate data, but is much more to do with politics and how much money might be made during the summer holiday season. Greece, for example, is open to the British but not to Swedes, while Croatia is open to both. Needless to say, Croatia (and neighboring Montenegro) have had massive surges in cases in the past few weeks, since they are open to most holiday-makers, having had relatively few cases before — it is now no safer to be there than in much of Sweden.

[Aside: My wife and I came back from a holiday in Croatia on the same day that the main influx of the virus arrived in Sweden from northern Italy, where is was acquired by Swedes who had taken the school break week to go downhill skiing. The other large source in Scandinavia was via those people who had gone to Austria for the same purpose.]

Protecting the elderly

This brings us to the biggest point of criticism within Sweden itself. This pandemic has highlighted very strongly just how badly elderly people are treated in this country. Put simply, I would never live in an aged-care home here, even if they were paying me, rather than the other way around.

First, let's look at the current data on age-related Covid cases in Sweden (compiled by Han Yin Lap). As you can see, 7.3% of the Covid-19 cases in Sweden have resulted in death, but 89.1% of those deaths have been in the 70+ age group. This is pretty much the same as elsewhere, sadly enough.


The problem in Sweden has been that the virus got into many of the aged-care homes long before anything was officially done about it. The government did not institute mandatory virus-testing of the staff (or even recommend it); and, as we now all know, it is the asymptomatic people who are the most dangerous in terms of spread. Furthermore, all reports (anecdotal as well as official) indicate that staff operational procedures were not modified before the middle of May, to protect either the patients or the staff (being a health-care worker is always risky: How many healthcare workers have gotten coronavirus?).

You can imagine the outcome for yourself. The worst case was in Jönköping County. This is not a densely populated place by any means, but the case rate has been 1.2% of the people, compared to the national rate of 0.8%. The virus got into a large aged-care facility, of course. The highest death rates have been been in Stockholm County (0.10%) and Södermanland County (0.08%), compared to the national 0.05%, for exactly the same reason.

Closer to home, my local newspaper recently reported the data shown in the following table (Stora skillnad i hur hårt äldreboenden drabbats. Upsala Nya Tidning, Lördag 4 juli 2020, p.6). Across 979 people in 20 aged-care facilities in Uppsala County, the death rate has been 5.8%, but varied from 0% to 18%. Only two facilities have so far reported no coronavirus-related deaths.


You can see why this has been a big discussion point, as this situation is by no means unusual in the other counties, except for Västerbotten (Inte enbart en slump att Västerbotten har få döda i covid-19). Indeed, it is a national disgrace.

The issue here has been the lack of government-instituted testing. Sweden has a nationalized health-care system, and it does not work any better than such systems ever do. I once lay in a hospital ward for a day and a half, fully scrubbed and prepared for surgery, to have my appendix removed. When they finally got around to me, the knot on my surgery gown was so tight that they had to cut the cord to get the thing off (with a laugh, of course). I have other anecdotes of similar nature.

So, as far as the pandemic has been concerned, the national government dithered for months before deciding that they would, indeed, bear much of the financial cost of testing. Until then, only people with symptoms were tested for the virus. What is the point of that?!! We needed to know who had the virus and did not themselves know it, not those whom we were already sure had it.

Anyway, without national funding, the counties, who do the actual sampling, typically do nothing. This is how a national health scheme works (or does not). Fortunately, the government finally started testing more widely for the virus, which created a spike in reported cases in June, as noted in the first graph above.

Recently, the government agreed to fund testing for antibodies, for anyone who wants it. Only two counties, Uppsala and Stockholm, immediately implemented this idea, at the beginning of this month. Sadly, my wife and I have now been waiting for 3 weeks for the results of our tests. We were told: "it make take a week", which in the Swedish health-care system translates as: "don't hold you breath". We have, of course, been sent our bills, for our (smallish) part of the cost.

Conclusion

So, there you have it. Sweden has done no worse than a lot of other places, in spite of doing things somewhat differently. There was no government-enforced lock-down, but instead a government-advised voluntary quarantine. This has worked okay, and certainly much better than the government lock-down in the USA; but plenty of countries in Europe have had lower case rates. The death rate is a bit embarrassing, because old people are not treated well in Sweden. In that sense, what I am doing living in Sweden in my sixties? As Pete Townsend once noted (My Generation): "I hope I die before I get old."

Note: For a slightly later but similar commentary by another local, see: Sweden did not take herd immunity approach against coronavirus pandemic.

Tattoo Monday XX


There are a number of tattoo designs that take the concept of a Tree of Life and incorporate the concept of DNA. Here is a selection of some of them. For an earlier example, see Tattoo Monday IV.


Posted by in Tattoo

Permalink

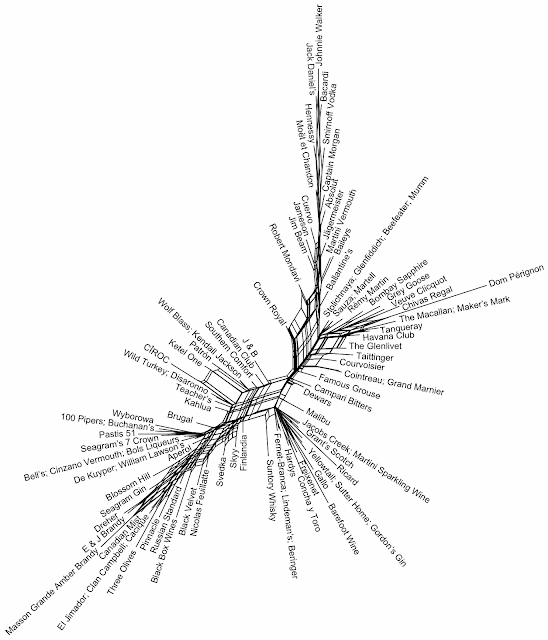
The power of wine and spirits brands in the marketplace


Commercial alcoholic beverages have all sorts of market characteristics, one of which is their ability to dominate their markets. This feature was investigated in a survey of the world’s leading drinks brands, published annually from 2006-2015 by the international company strategists Intangible Business. This was called The Power 100, in which each brand was given a power score, allowing them to be ranked.


Intangible Business apparently researched c. 10,000 spirit and wine brands across the globe, to assess both the financial contribution of each brand and its strength in the eyes of the consumer. To do this, they combined scores from a panel of drinks industry experts with global sales data (see Methodology, and Panelists). [Note: the resulting reports used to be housed at www.drinkspowerbrands.com, but this site disappeared in 2017, with 2015 as the final report.]

The Brand Score (out of 100) was produced by the panelists, who scored each brand for these eight characteristics (scale: 0–10):
  • Share of market: a volume-based measure of market share
  • Future Growth: projected growth based on 10 years of historical data plus future trends
  • Premium Price Positioning: a measure of the brand’s ability to command a premium
  • Market Scope: number of markets in which the brand has a significant presence
  • Brand Awareness: a combination of prompted and spontaneous awareness
  • Brand Relevancy: capacity to relate to the brand and a propensity to purchase
  • Brand Heritage: the brand’s longevity and a measure of how it is embedded in local culture
  • Brand Perception: loyalty, and how close a strong brand image is to a desire for ownership.
This Score was then turned into a Total Score (out of 100) by multiplying this by the brand's weighted sales volume. It was this Total Score that was used for the final Power list, with the top 100 being listed each year. However, I am not interested in this here — the Total Score is dominated by the sales volume, not by the Brand Score. The latter seems more interesting, so I will look at it here.

Across the 10 years, 141 brands appeared at least once, although only 68 (48%) of them appeared in all 10 surveys, with another 8 appearing in 9/10 years. That is, only half of the brands had any sustained Power. In the other cases, the brands either appeared in the early surveys only, or in the later surveys only — very few came and went from year to year (implying that they were just on the border of the top 100).

Network of the Brand Scores for 2015

As usual in this blog, we can get a picture of the variation among brands by using a phylogenetic network, as a form of exploratory data analysis. For the first analysis, I calculated the similarity across the 8 Brand Score criteria using the Manhattan distance, based on those 100 brands that appeared in the final (2015) report. A Neighbor-net analysis was then used to display the between-year similarities, as shown in the graph above. Brands that are closely connected in the network are similar to each other based on their Brand Score, and those that are further apart are progressively more different from each other.

There is a general trend of high scores at the top of the network downwards to the bottom left. However, the network does not show a simple trend, such as is implied by the 1-dimensional ranking produced in the original Intangible Business report. That is, there is a complexity among the scores — it is possible for two brands to get the same Brand Score but to get it by scoring highly on quite different criteria. This illustrates the importance of using multi-dimensional summaries for exploratory data analysis — the patterns to be found may not be simple.

In this particular case, note that some brands, like Crown Royal and Dom Perignon, diverge greatly from the overall trend, indicating that they have unusual combinations of scores. Also, the two neighborhoods at the left and right of the network have different combinations from each other, although they end up with similar overall Brand Scores.

Network of the average Brand Scores across the 10 years

For the second analysis, I compared the different years. I calculated the Brand Score similarity across the 10 years using the Manhattan distance, based only on those 104 brands that appeared in at least 5 of the years. A Neighbor-net analysis was then used to display the between-year similarities, as shown in the second graph.

As you can see, in this case the network is as linear as you could expect, indicating that there is little more than 1 dimension of information to summarize. In this case, it basically shows a single rank-ordering of the Brand Scores averaged across the years (with the highest average score at the top of the network and the lowest at the bottom). So, in this case it is much simpler just to list the average Brand Scores in a table, rather than use the network (keep it simple!) — the network is being used to check whether there are more complex patterns, but not to display the pattern found.

This table is shown next, because it has never been listed before (none of the original reports compare all of the years). You can find your favorite brand, and check how "powerful" it has been in the maketplace, across time. Spirits do better than wines, but there is no consistency about which types of spirits do best.

Brand
Johnnie Walker
Bacardi
Hennessy
Jack Daniel's
Moët et Chandon
Smirnoff Vodka
Absolut
Dom Pérignon
Baileys
Veuve Clicquot
Chivas Regal
Captain Morgan
Cuervo
Martini Vermouth
Jameson
The Macallan
Ballantine's
Havana Club
Rémy Martin
Jägermeister
Maker's Mark
Glenfiddich
Martell
Jim Beam
Grey Goose
Bombay Sapphire
The Glenlivet
Concha y Toro
Robert Mondavi
Stolichnaya
Beefeater
Gordon's Gin
Courvoisier
Malibu
Tanqueray
Sauza
Crown Royal
Taittinger
Mumm
J & B
Patrón
Penfolds
Hardys
Cointreau
Freixenet
Gallo
Wolf Blass
Southern Comfort
Jacobs Creek
Campari Bitters
Famous Grouse
Torres
Grand Marnier
Canadian Club
Finlandia
Piper Heidsieck
Laurent Perrier
Beringer
Dewars
Kahlua
Martini Sparkling Wine
Yellowtail
Lindeman's
Svedka
Skyy
Wild Turkey
Grant's Scotch
Teacher's
Ketel One
De Kuyper
Kendall Jackson
Nicolas Feuillatte
Cutty Sark
Aperol
Disaronno
Ricard
Cinzano Vermouth
Russian Standard
Fernet-Branca
Bell's
Blossom Hill
Sutter Home
William Lawson's
Wyborowa
El Jimador
Bols Liqueurs
Eristoff
Clan Campbell
Seagram's 7 Crown
100 Pipers
Seagram Gin
Ramazzotti Amaro
Inglenook
Black Velvet
Three Olives
Seagram V.O.
Cacique
Metaxa
E & J Brandy
Canadian Mist
Dreher
Masson Grande Amber Brandy
Pastis 51
Moskowskaya
Category
Blended Scotch
Rum / Cane
Cognac
US Whiskey
Champagne
Vodka
Vodka
Champagne
Liqueurs
Champagne
Blended Scotch
Rum / Cane
Tequila
Light Aperitif
Blended Irish Whiskey
Malt Scotch
Blended Scotch
Rum / Cane
Cognac
Bitters / Spirit Aperitifs
US Whiskey
Malt Scotch
Cognac
US Whiskey
Vodka
Gin / Genever
Malt Scotch
Still Light Wine
Still Light Wine
Vodka
Gin / Genever
Gin / Genever
Cognac
Liqueurs
Gin / Genever
Tequila
Canadian Whisky
Champagne
Champagne
Blended Scotch
Tequila
Still Light Wine
Still Light Wine
Liqueurs
Other Sparkling
Still Light Wine
Still Light Wine
Liqueurs
Still Light Wine
Bitters / Spirit Aperitifs
Blended Scotch
Still Light Wine
Liqueurs
Canadian Whisky
Vodka
Champagne
Champagne
Still Light Wine
Blended Scotch
Liqueurs
Other Sparkling
Still Light Wine
Still Light Wine
Vodka
Vodka
US Whiskey
Blended Scotch
Blended Scotch
Vodka
Liqueurs
Still Light Wine
Champagne
Blended Scotch
Light Aperitif
Liqueurs
Aniseed
Light Aperitif
Vodka
Bitters / Spirit Aperitifs
Blended Scotch
Still Light Wine
Still Light Wine
Blended Scotch
Vodka
Tequila
Liqueurs
Georgian Vodka
Blended Scotch
US Whiskey
Blended Scotch
Gin / Genever
Bitters / Spirit Aperitifs
Still Light Wine
Canadian Whisky
Vodka
Canadian Whisky
Rum / Cane
Other Brandy
Other Brandy
Canadian Whisky
Other Brandy
Other Brandy
Aniseed
Vodka
Brand Score
81.0
76.9
76.9
76.8
74.2
73.6
70.8
69.7
69.3
69.3
69.1
67.4
67.1
66.3
65.7
63.4
63.4
63.3
63.2
62.8
62.0
62.0
61.9
61.6
61.6
60.9
60.8
60.7
60.4
60.2
59.7
58.7
58.7
57.8
57.7
57.7
57.1
57.0
57.0
56.9
56.9
56.4
56.1
55.9
55.7
55.6
55.4
55.3
55.0
54.7
54.7
54.5
54.5
54.0
53.9
53.2
52.9
52.6
52.5
52.2
52.2
52.1
52.0
51.9
51.8
51.8
51.5
51.1
51.0
50.4
50.0
49.2
49.1
49.0
49.0
49.0
48.8
48.7
48.4
48.0
47.6
47.1
46.4
45.8
45.1
45.0
44.1
43.7
43.1
42.4
42.3
42.3
42.2
42.0
41.9
41.0
40.6
39.6
39.5
39.3
39.3
37.7
37.6
37.0

A new SARS-CoV-2 variant?


In previous blog posts, Guido has examined the phylogenetic patterns in the current SARS-CoV-2 outbreak, responsible for the socially disruptive Covid-19 pandemic:
These patterns are traceable because, being a virus, there is a high mutation rate in the genome, and many genomes have been sequenced. Even on the Diamond Princess boat, it is clear that a number of genetic variants arose during its few weeks of quarantine.

Guido analyzed in detail some of these known variants, and their associated genome mutations. He carefully tried to distinguish possible sequencing artifacts from genuine mutations, and which of the latter seem to be the result of genomic recombination among different strains. Naturally, he did this in the context of using phylogenetic networks as the preferred tool of analysis.


Needless to say, Guido is not the only person to have tried this sort of analysis, although people do not really seem to have grasped that recombination as a molecular process requires the concept of a phylogenetic network. There is an intellectual fixation with phylogenetic trees rather than networks. The tree approach is to detect incompatibilities among the trees, and to deduce recombination as the cause. However, why demonstrate that your preferred analysis method fails, and reach a conclusion from this, when you could simply analyze the data appropriately in the first place?

One recent pre-print that has attracted a lot of attention, based on looking for genetic mutations in a single gene, and then using a tree-based analysis, is:
 Spike mutation pipeline reveals the emergence of a more transmissible form of SARS-CoV-2

The attention-getting part of the paper is that a particular mutation variant of the virus seems to be getting more common among hosts, and in some places has become the dominant strain. The authors conclude that the mutation has been positively selected due to greater infectivity. This is potentially important because the gene being studied is the Spike (or S) protein, which creates the distinctive crown-like appearance of the virus itself. This crown mediates infection of host cells, and is thus the target of most vaccine strategies and antibody-based therapies. Clearly, then, this variant might be of great practical interest.

However, while the press coverage has been enthusiastic, most of the professional commentary so far has been unimpressed with the authors' conclusions. Basically, the reaction to the authors has been "not so fast, guys". The evidence is suggestive at best, and not yet verified (see We don’t know yet whether a mutation has made SARS-CoV-2 more infectious).

Comments

My points in this blog post are about the analyses. There are two parts to the analyses: the identification of mutations and selection, and the study of recombination.

First, only one mutation has been identified, which appears to increase in prevalence through time. So, the conclusion that the new variant is more virulent seems to be based on the idea that it becomes the dominant strain in any population. If this is so, then we still have only one main variant to deal with, in terms of medical response. Indeed, if this variant has been around since February, as the report claims, then most infected people must have it. The only people who wouldn't have this one would be the very earliest cases.

Moreover, if a mutation is positively selected, then it must be difficult to distinguish reticulation from convergence. If variants that gain a mutation via reticulation become dominant, then with every generation we increase the probability that the same mutation will be independently obtained by another virus lineage. Being positively selected, these independent mutations will quickly be dispersed. Given that the virus has been around now for nearly 5 months, with a steadily increasing and diversifying available-host population, there would be plenty of time for convergent evolution of the same beneficial mutation.

Second, phylogenetic trees are often used to try to study the origin of genetic variation, especially if there has been recurrent emergence of particular variants, each of which has subsequently diverged independently. This was Charles Darwin's idea when he talked about the tree as a model for evolution. However, Darwin's book also has a long chapter on hybridization, which cannot easily be studied using the tree model. This apparent contradiction did not concern Darwin, because his book is mostly about the continuity of evolutionary history, which was his main motivation for using the tree model. Hybridization is evidence for continuity, even though the tree model is too simple for studying it. The same argument applies to the study of introgression.

It is the same for processes like recombination, which is conceptually no different, although it occurs at the molecular level, instead. As far as the new paper is concerned, its Figure 1, which is a couple of phylogenetic trees, does not fit well with Figure 6, which is a set of alignments illustrating recombination. Why authors cannot see contradictions between different parts of their own work remains a mystery.

As a final note, the authors raise the specter of re-infection by the new SARS-CoV-2 variant. However, it is our developed immunity (ie. production of antibodies) that protects us, epidemiologically. To allow re-infection, the virus would need to avoid these antibodies. Being more infectious does not automatically make a virus able to avoid antibodies. Nevertheless, I would not be surprised if we learn that some people become ill more than once. (NB. This is different from saying that people have multiple strains. Multiple infections do not necessarily result in multiple illnesses, because of the antibodies.) A bigger concern for new illnesses is likely to be the observed large variation in the amount of antibodies that people produce (more is better, of course).