Election modeling explained

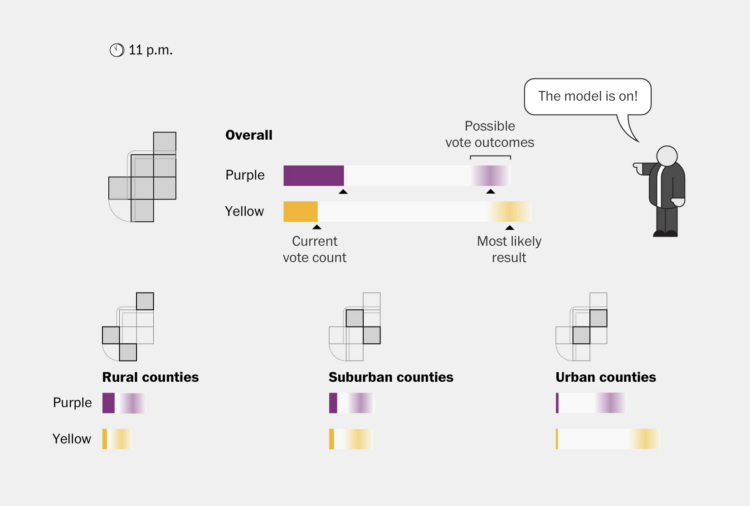
In election reporting, there’s a gap between real-time results and final results, so news orgs use statistical models to show where results appear to be headed. For The Washington Post, Adrian Blanco and Artur Galocha explain the basic concepts behind their model, using a fictional state called Voteland.

Tags: , ,

Agent-based modeling in JavaScript

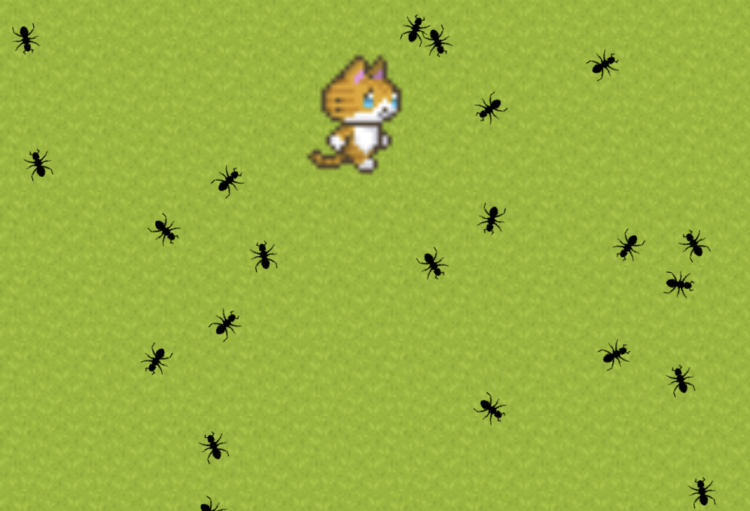
Atomic Agents is a JavaScript library by Graham McNeill that can help simulate the interactions between people, places, and things in a two-dimensional space. Saving for later. Looks fun.

Tags: , , ,

Teaching statistical models with wine tasting

For The Pudding, Lars Verspohl provides an introduction to statistical models disguised as a lesson on finding good wine. Start with a definition of wine, which becomes a way to describe it with the numbers. Define what makes a wine good. Find the wines that look closer to that definition.

Tags: , ,

How experts use disease modeling to help inform policymakers

Harry Stevens and John Muyskens for The Washington Post put you in the spot of an epidemiologist receiving inquiries from policymakers about what might happen:

Imagine you are an epidemiologist, and one day the governor sends you an email about an emerging new disease that has just arrived in your state. To avoid the complexities of a real disease like covid-19, the illness caused by the novel coronavirus, we have created a fake disease called Simulitis. In the article below, we’ll give you the chance to model some scenarios — and see what epidemiologists are up against as they race to understand a new contagion.

Fuzzy numbers, meet real-world decisions.

Tags: , , , ,

Comparing Covid-19 models

FiveThirtyEight compared six Covid-19 models for a sense of where we might be headed. With different assumptions and varying math, the trajectories vary, but they at least provide clues so that policymakers can make educated decisions.

If you’re interested in the data behind these models, check out the COVID-19 Forecast Hub maintained by the Reich Lab at the University of Massachusetts Amherst. They helped with the FiveThirtyEight comparisons and are also the source for the official CDC forecast page.

Tags: , ,

Challenges of making a reliable Covid-19 model

Fatalities from Covid-19 range from the hundreds of thousands to the millions. Nobody knows for sure. These predictions are based on statistical models, which are based on data, which aren’t consistent and reliable yet. FiveThirtyEight, whose bread and butter is models and forecasts, breaks down the challenges of making a model and why they haven’t provided any.

Tags: , ,

Myth of the impartial machine

In its inaugural issue, Parametric Press describes how bias can easily come about when working with data:

Even big data are susceptible to non-sampling errors. A study by researchers at Google found that the United States (which accounts for 4% of the world population) contributed over 45% of the data for ImageNet, a database of more than 14 million labelled images. Meanwhile, China and India combined contribute just 3% of images, despite accounting for over 36% of the world population. As a result of this skewed data distribution, image classification algorithms that use the ImageNet database would often correctly label an image of a traditional US bride with words like “bride” and “wedding” but label an image of an Indian bride with words like “costume”.

Click through to check out the interactives that serve as learning aids. The other essays in this first issue are also worth a look.

Tags: , , ,

Game of Thrones death predictor

Monica Ramirez tried her hand with modeling deaths on Game of Thrones and trying to predict the next ones:

Since the series is so famous for killing principal characters (It’s true! Yu can’t have a favourite character because he/she wouls die, and slowly, other characters take the lead… and would probably die too), I decided to make a Classification Model in Python, to try to find any rule or pattern and discopver: Who will die on this last season?

I’m always on a viewing delay with this stuff, so I’m not sure whether this is right or completely wrong, but there you go. The above shows the characters ordered by probability of death (not order in which they will die).

Tags: , ,